emooki
HomePrice mapTransactions
🇬🇧 English🇫🇷 Français🇩🇪 Deutsch🇪🇸 Español🇮🇹 Italiano

Real estate price map


Real estate price map in the municipality of Argentré-du-Plessis.

Ille-et-Vilaine (35)
Argentré-du-Plessis

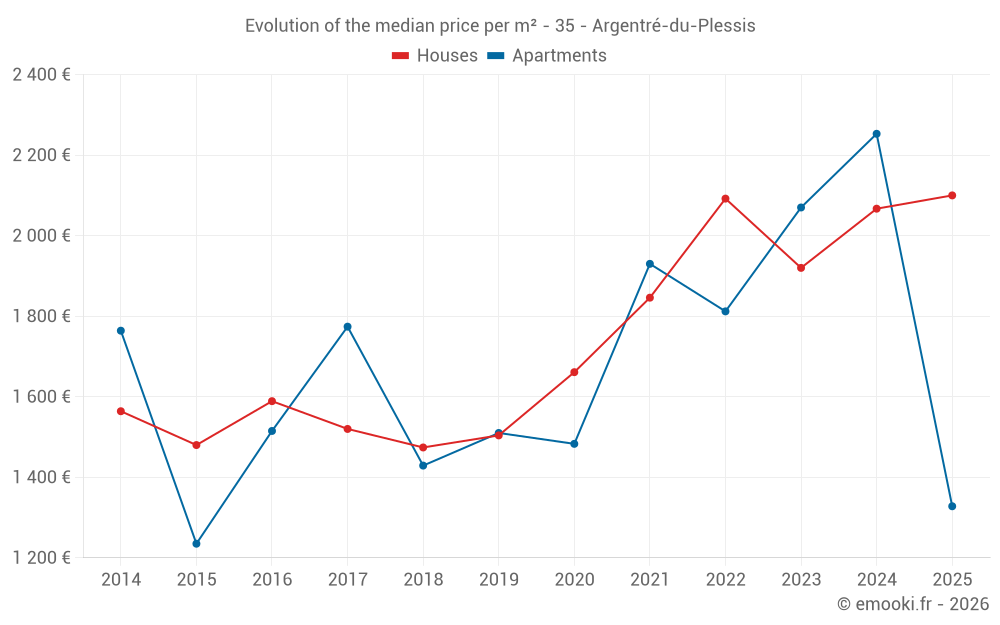
Median price of real estate
in the municipality of Argentré-du-Plessis

HousesHouses
2 100  /m²
1-23-45-67-89-10
Reliability 9/10
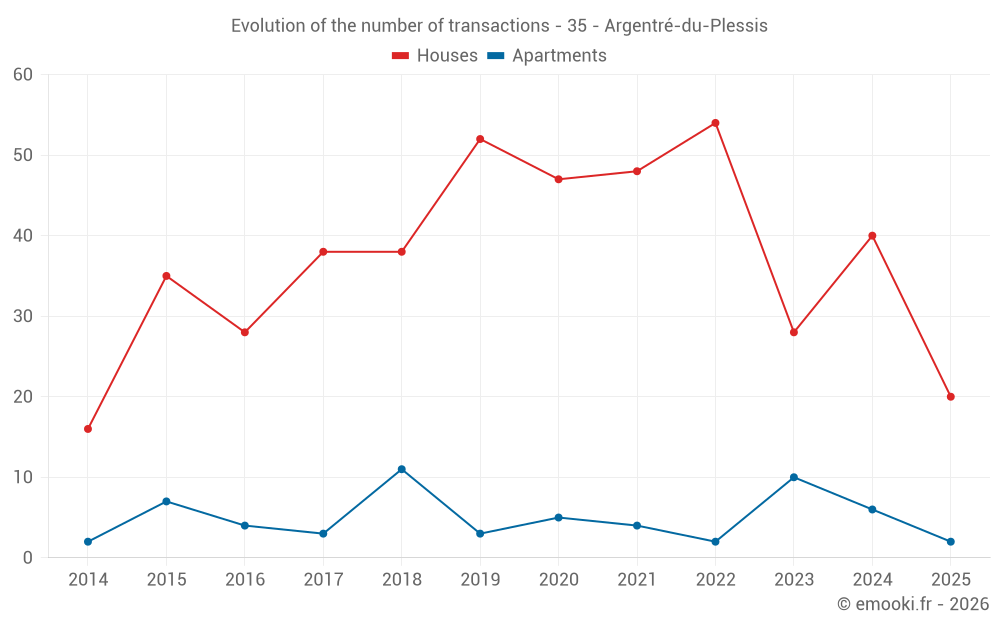
Median price on the 20 transactions of the last 6 months.
from 1 305 to
2 382  /m²
60% of transactions from the 2nd to the 8th deciles.
ApartmentsApartments
2 222  /m²
1-23-45-67-89-10
Reliability 6/10
Median price on the 19 transactions of the last 36 months.
from 1 537 to
2 426  /m²
60% of transactions from the 2nd to the 8th deciles.
DwellingsDwellings
2 084  /m²
1-23-45-67-89-10
Reliability 9/10
Median price on the 22 transactions of the last 6 months.
from 1 273 to
2 322  /m²
60% of transactions from the 2nd to the 8th deciles.
HousesEvolution of the price per m² of houses since...
1 year
+1.6%
2 years
+9.4%
3 years
+0.4%
4 years
+14%
5 years
+26%
6 years
+40%
7 years
+42%
8 years
+38%
9 years
+32%
10 years
+42%
11 years
+34%
ApartmentsEvolution of the price per m² of apartments since...
1 year
--
2 years
--
3 years
--
4 years
--
5 years
--
6 years
--
7 years
--
8 years
--
9 years
--
10 years
--
11 years
--

Yearly evolution

Evolution of the median price per m²

Evolution of the number of transactions

Warning, last year incomplete. Projections made based on the proportions between semesters of the previous year at the departmental/national level and by type of property.

Yearly data

Descending order
Year
Houses
house
transactions
Houses
house
Price per m²
Apartments
apt.
transactions
Apartments
apt.
Price per m²
2025
20
2 100 
2
1 328 
2024
40
2 067 
6
2 253 
2023
28
1 920 
10
2 070 
2022
54
2 092 
2
1 812 
2021
48
1 846 
4
1 930 
2020
47
1 661 
5
1 483 
2019
52
1 504 
3
1 510 
2018
38
1 474 
11
1 429 
2017
38
1 520 
3
1 774 
2016
28
1 589 
4
1 515 
2015
35
1 480 
7
1 235 
2014
16
1 564 
2
1 764 

Analysis

Structure of prices per m²

Values of price percentiles per m² over the periods used for the estimated price of each type of property.

Structure of transaction amounts

Values of transaction amounts percentiles over the periods used for the estimated price of each type of property.

Transaction amounts and prices per m² by percentile

Ascending order
Percentile
Houses
house
Price per m²
Houses
house
Transaction amount
Apartments
apt.
Price per m²
Apartments
apt.
Transaction amount
10th percentile
999 
89 000 
1 374 
73 800 
20th percentile
1 305 
128 K
1 537 
88 200 
30th percentile
1 636 
136 K
1 857 
96 520 
40th percentile
2 063 
144 K
2 039 
101 K
50th percentile
2 100 
176 K
2 222 
105 K
60th percentile
2 189 
208 K
2 263 
123 K
70th percentile
2 278 
240 K
2 364 
127 K
80th percentile
2 382 
300 K
2 426 
141 K
90th percentile
2 700 
301 K
2 497 
169 K

National and departmental comparison

Evolution of the median price per m² of houses

Evolution of the median price per m² of apartments

Quarterly evolution

Evolution of the median price per m²

Evolution of the number of transactions

Quarterly data

Descending order
Quarter
Houses
house
transactions
Houses
house
Price per m²
Apartments
apt.
transactions
Apartments
apt.
Price per m²
2025 Q2
7
2 074 
0
--- 
2025 Q1
13
2 106 
2
1 328 
2024 Q4
8
1 974 
2
1 212 
2024 Q3
12
2 024 
1
2 236 
2024 Q2
12
1 910 
2
2 246 
2024 Q1
8
2 272 
1
2 480 
2023 Q4
7
1 844 
2
2 070 
2023 Q3
4
2 177 
3
2 333 
2023 Q2
8
2 315 
1
1 763 
2023 Q1
9
1 733 
4
2 192 
2022 Q4
9
2 035 
0
--- 
2022 Q3
16
1 906 
1
2 567 
2022 Q2
15
2 200 
0
--- 
2022 Q1
14
2 091 
1
1 057 
2021 Q4
10
2 002 
1
2 134 
2021 Q3
18
1 964 
2
1 930 
2021 Q2
12
1 767 
1
1 742 
2021 Q1
8
1 811 
0
--- 
2020 Q4
13
1 803 
1
1 483 
2020 Q3
14
1 450 
1
845 
2020 Q2
5
1 538 
3
1 603 
2020 Q1
15
1 555 
0
--- 
2019 Q4
11
1 518 
0
--- 
2019 Q3
16
1 650 
2
1 156 
2019 Q2
10
1 554 
0
--- 
2019 Q1
15
1 250 
1
1 541 
2018 Q4
7
1 171 
4
1 164 
2018 Q3
14
1 484 
3
1 443 
2018 Q2
11
1 585 
4
1 437 
2018 Q1
6
1 121 
0
--- 
2017 Q4
13
1 432 
0
--- 
2017 Q3
7
1 528 
1
1 774 
2017 Q2
6
1 616 
0
--- 
2017 Q1
12
1 477 
2
1 394 
2016 Q4
8
1 462 
2
2 090 
2016 Q3
12
1 612 
1
1 141 
2016 Q2
4
1 700 
1
1 205 
2016 Q1
4
1 650 
0
--- 
2015 Q4
8
1 552 
4
1 416 
2015 Q3
4
1 554 
1
1 024 
2015 Q2
13
1 557 
2
1 330 
2015 Q1
10
1 322 
0
--- 
2014 Q4
4
1 565 
0
--- 
2014 Q3
5
1 600 
2
1 764 
2014 Q2
1
1 719 
0
--- 
2014 Q1
6
1 478 
0
--- 

Ille-et-Vilaine (35)

Most expensive cities

City
name
Descending orderHouses
house
Price per m²
5 682 
5 538 
4 545 
4 504 
4 150 
4 118 
3 857 
3 721 
3 714 
City
name
Descending orderApartments
apt.
Price per m²
5 306 
5 061 
4 627 
4 194 
4 011 
3 914 
3 835 
3 755 

Least expensive cities

City
name
Ascending orderHouses
house
Price per m²
982 
1 041 
1 047 
1 111 
1 125 
1 128 
1 150 
City
name
Ascending orderApartments
apt.
Price per m²
238 
267 
315 
352