emooki
HomePrice mapTransactions
🇬🇧 English🇫🇷 Français🇩🇪 Deutsch🇪🇸 Español🇮🇹 Italiano

Real estate price map


Real estate price map in the municipality of Lunas-les-Châteaux, choose a section to see transactions by parcel.

Hérault (34)
Lunas-les-Châteaux

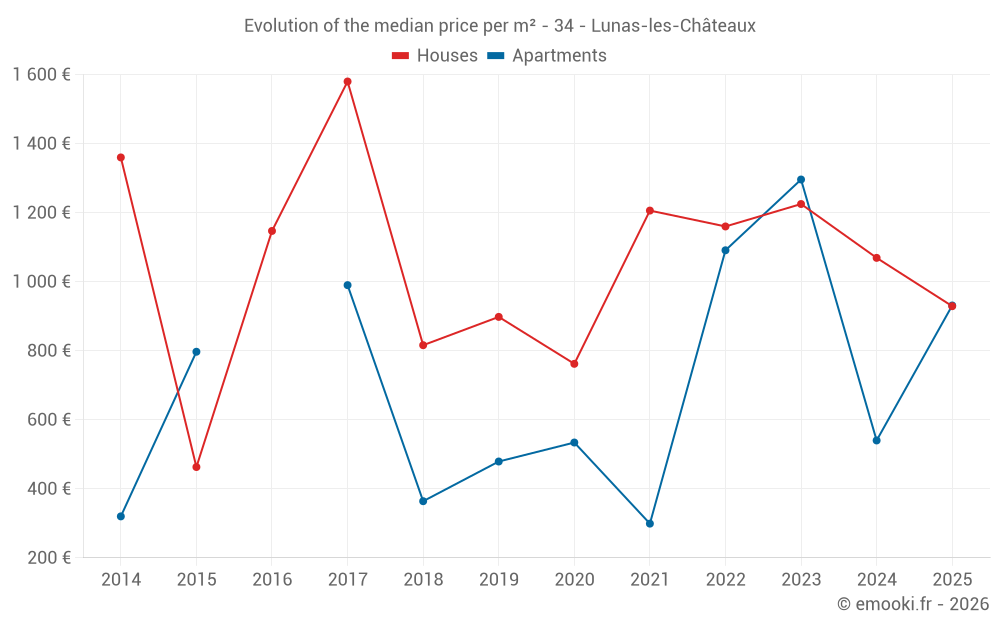
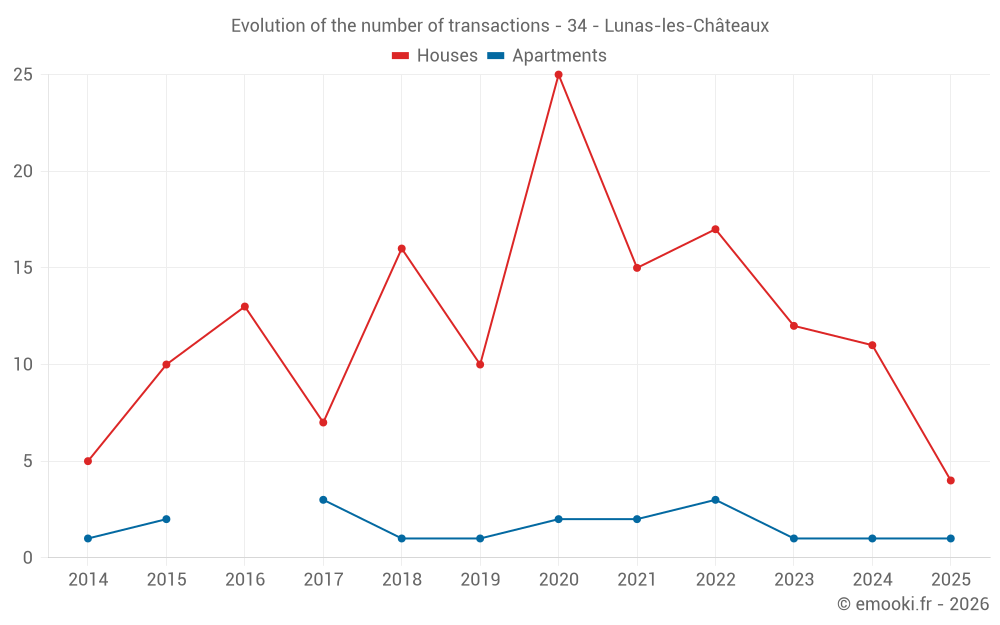
Median price of real estate
in the municipality of Lunas-les-Châteaux

HousesHouses
1 092  /m²
1-23-45-67-89-10
Reliability 7/10
Median price on the 20 transactions of the last 24 months.
from 757 to
2 044  /m²
60% of transactions from the 2nd to the 8th deciles.
ApartmentsApartments
777  /m²
1-23-45-67-89-10
Reliability 4/10
Median price on the 9 transactions of the last 60 months.
DwellingsDwellings
1 069  /m²
1-23-45-67-89-10
Reliability 7/10
Median price on the 23 transactions of the last 24 months.
from 649 to
1 922  /m²
60% of transactions from the 2nd to the 8th deciles.
HousesEvolution of the price per m² of houses since...
1 year
-13%
2 years
-24%
3 years
-20%
4 years
-23%
5 years
+22%
6 years
+3.5%
7 years
+14%
8 years
-41%
9 years
-19%
10 years
+101%
11 years
-32%
The price per m² of houses has decreased by 41% since 8 years, but it has increased by 101% in 10 years.

Yearly evolution

Evolution of the median price per m²

Evolution of the number of transactions

Warning, last year incomplete. Projections made based on the proportions between semesters of the previous year at the departmental/national level and by type of property.

Yearly data

Descending order
Year
Houses
house
transactions
Houses
house
Price per m²
Apartments
apt.
transactions
Apartments
apt.
Price per m²
2025
4
929 
1
931 
2024
11
1 069 
1
540 
2023
12
1 225 
1
1 296 
2022
17
1 160 
3
1 091 
2021
15
1 206 
2
299 
2020
25
762 
2
534 
2019
10
898 
1
479 
2018
16
816 
1
364 
2017
7
1 580 
3
990 
2016
13
1 147 
0
--- 
2015
10
463 
2
797 
2014
5
1 360 
1
320 

Analysis

Structure of prices per m²

Values of price percentiles per m² over the periods used for the estimated price of each type of property.

Structure of transaction amounts

Values of transaction amounts percentiles over the periods used for the estimated price of each type of property.

Transaction amounts and prices per m² by percentile

Ascending order
Percentile
Houses
house
Price per m²
Houses
house
Transaction amount
Apartments
apt.
Price per m²
Apartments
apt.
Transaction amount
10th percentile
526 
25 800 
319 
22 666 
20th percentile
757 
42 880 
457 
27 333 
30th percentile
833 
57 400 
559 
52 800 
40th percentile
1 028 
68 320 
626 
88 600 
50th percentile
1 092 
88 500 
777 
95 000 
60th percentile
1 202 
112 K
900 
111 K
70th percentile
1 744 
122 K
1 027 
118 K
80th percentile
2 044 
186 K
1 173 
125 K
90th percentile
2 163 
251 K
1 310 
136 K

National and departmental comparison

Evolution of the median price per m² of houses

Evolution of the median price per m² of apartments

Quarterly evolution

Evolution of the median price per m²

Evolution of the number of transactions

Quarterly data

Descending order
Quarter
Houses
house
transactions
Houses
house
Price per m²
Apartments
apt.
transactions
Apartments
apt.
Price per m²
2025 Q2
2
673 
0
--- 
2025 Q1
2
1 722 
1
931 
2024 Q4
4
946 
0
--- 
2024 Q3
2
782 
0
--- 
2024 Q2
2
1 285 
1
540 
2024 Q1
3
2 070 
0
--- 
2023 Q4
2
1 142 
0
--- 
2023 Q3
3
1 742 
1
1 296 
2023 Q2
4
1 124 
0
--- 
2023 Q1
3
2 174 
0
--- 
2022 Q4
5
1 018 
0
--- 
2022 Q3
4
1 780 
1
1 091 
2022 Q2
4
1 510 
1
1 366 
2022 Q1
4
629 
1
777 
2021 Q4
5
1 206 
0
--- 
2021 Q3
2
1 238 
1
333 
2021 Q2
4
1 354 
0
--- 
2021 Q1
4
1 343 
1
265 
2020 Q4
10
859 
1
588 
2020 Q3
4
506 
0
--- 
2020 Q2
8
626 
1
480 
2020 Q1
3
1 102 
0
--- 
2019 Q4
2
942 
0
--- 
2019 Q3
4
1 181 
0
--- 
2019 Q2
4
736 
1
479 
2018 Q4
4
816 
0
--- 
2018 Q3
4
670 
1
364 
2018 Q2
3
633 
0
--- 
2018 Q1
5
900 
0
--- 
2017 Q4
1
1 225 
0
--- 
2017 Q3
4
1 446 
2
2 026 
2017 Q2
2
1 776 
1
882 
2016 Q4
4
1 372 
0
--- 
2016 Q3
2
834 
0
--- 
2016 Q2
4
1 380 
0
--- 
2016 Q1
3
1 147 
0
--- 
2015 Q4
5
426 
0
--- 
2015 Q3
1
500 
1
321 
2015 Q2
1
376 
1
1 273 
2015 Q1
3
1 181 
0
--- 
2014 Q4
1
533 
1
320 
2014 Q2
1
1 708 
0
--- 
2014 Q1
3
1 360 
0
--- 

Overview of the latest real estate transactions

The following list is an anonymized overview of the latest transactions. For more details and to find all transactions, please use the map to view transactions by plot or the transaction search page for a search by criteria.

2025-06-10
100 
Sale
Land
20 m2
-Jardins
/Jardin potager
2025-05-07
5 000 
Sale
Land
760 m2
-Vignes
Land
610 m2
-Prés
Land
11 m2
-Sols
Land
800 m2
-Vignes
2025-05-06
50 
Sale
Land
24 m2
-Vignes
2025-04-29
41 000 
Sale
1 outbuilding
2025-04-29
32 000 
533  /m²(60 m²)
Sale
Houses
House
3 rooms
60 m2
Land
47 m2
-Sols
2025-04-07
26 000 
813  /m²(32 m²)
Sale
Houses
House
1 room
32 m2
Land
22 m2
-Sols
2025-02-28
95 000 
931  /m²(102 m²)
Sale
Apartments
Apartment
3 rooms
50 m2
Apartments
Apartment
2 rooms
52 m2
3 outbuildings
2025-02-13
31 412 
Sale
Land
600 m2
-Landes
/Pâture plantée
Land
4490 m2
-Terres
Land
4730 m2
-Terres
Land
620 m2
-Landes
/Pâture plantée
Land
765 m2
-Vignes
Land
1315 m2
-Landes
/Pâture plantée
Land
2130 m2
-Vignes
Land
8730 m2
-Vignes
Land
6780 m2
-Vignes
2025-02-13
2 250 
Exchange
Land
7105 m2
-Vignes
Land
5670 m2
-Terres
2025-02-04
2 500 
Sale
Land
330 m2
-Jardins
2025-01-29
180 000 
2 400  /m²(75 m²)
Sale
Houses
House
3 rooms
75 m2
2 outbuildings
Land
1878 m2
-Terrains d'agrément
Land
500 m2
-Sols
Land
1710 m2
-Vignes
Land
380 m2
-Landes
/Pâture plantée
Land
155 m2
-Vignes
2025-01-24
126 500 
1 045  /m²(121 m²)
Sale
Houses
House
4 rooms
121 m2
Land
450 m2
-Sols
2024-12-23
22 000 
Sale
Land
240 m2
-Landes
/Pâture plantée
Land
600 m2
-Landes
/Pâture plantée
Land
8 m2
-Sols
Land
650 m2
-Vignes
Land
12 m2
-Sols
Land
110 m2
-Sols
Land
270 m2
-Jardins
Land
660 m2
-Terres
2024-12-20
45 600 
465  /m²(98 m²)
Sale
Houses
House
3 rooms
98 m2
Land
140 m2
-Sols
2024-12-20
83 000 
Sale
Land
130 m2
-Sols
2024-12-19
250 000 
2 137  /m²(117 m²)
Sale
Houses
House
6 rooms
117 m2
1 outbuilding
Land
6000 m2
-Terres
Land
730 m2
-Sols
Land
10 m2
-Sols
2024-12-18
154 000 
37  /m²(4210 m²)
2 026  /m²(76 m²)
Sale
Apartments
Apartment
1 room
13 m2
Apartments
Apartment
1 room
25 m2
Apartments
Apartment
1 room
13 m2
Apartments
Apartment
1 room
25 m2
Commercial property
4134 m2
Land
5660 m2
-Sols
Land
1800 m2
-Terres
2024-12-13
120 000 
822  /m²(146 m²)
Sale
Houses
House
4 rooms
146 m2
Land
110 m2
-Sols
Land
60 m2
-Sols
2024-11-29
400 
Sale
Land
2926 m2
-Futaies résineuses
2024-11-08
77 000 
1 069  /m²(72 m²)
Sale
Houses
House
4 rooms
72 m2
Land
66 m2
-Sols
427 transactions listed in the municipality

Hérault (34)

Most expensive cities

City
name
Descending orderHouses
house
Price per m²
6 604 
6 267 
4 826 
4 550 
4 500 
4 436 
4 422 
4 418 
City
name
Descending orderApartments
apt.
Price per m²
5 318 
4 953 
4 917 
4 496 
4 294 
4 214 
4 145 

Least expensive cities

City
name
Ascending orderHouses
house
Price per m²
426 
684 
848 
1 008 
City
name
Ascending orderApartments
apt.
Price per m²
267 
302 
308 
337 
338 
448 
454 
481