emooki
SearchPrice mapTransactions
🇬🇧 English🇫🇷 Français🇩🇪 Deutsch🇪🇸 Español🇮🇹 Italiano

Real estate price map


Real estate price map in the municipality of Le Bousquet-d'Orb.

Hérault (34)
Le Bousquet-d'Orb

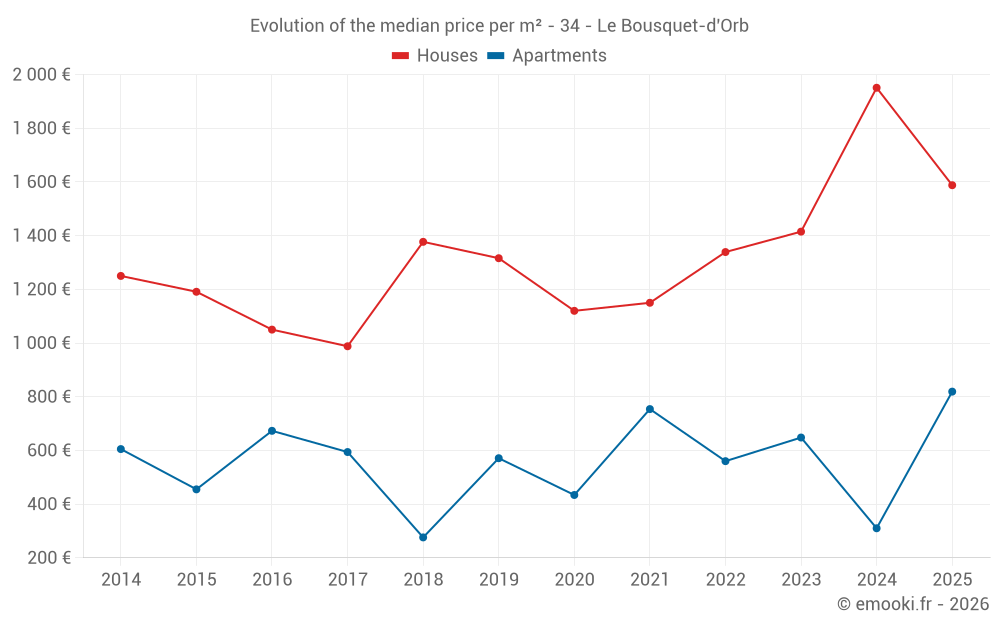
Median price of real estate
in the municipality of Le Bousquet-d'Orb

HousesHouses
1 777 € /m²
1-23-45-67-89-10
Reliability 8/10
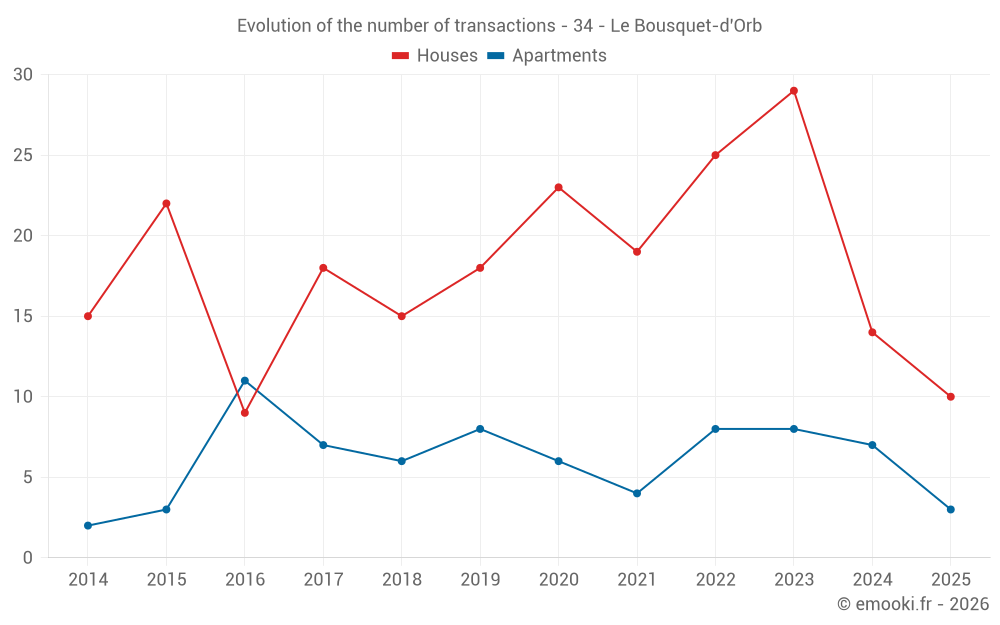
Median price on the 16 transactions of the last 12 months.
from 1 036 to
2 358 € /m²
60% of transactions from the 2nd to the 8th deciles.
ApartmentsApartments
628 € /m²
1-23-45-67-89-10
Reliability 7/10
Median price on the 16 transactions of the last 24 months.
from 218 to
882 € /m²
60% of transactions from the 2nd to the 8th deciles.
DwellingsDwellings
1 213 € /m²
1-23-45-67-89-10
Reliability 8/10
Median price on the 23 transactions of the last 12 months.
from 804 to
2 038 € /m²
60% of transactions from the 2nd to the 8th deciles.
HousesEvolution of the price per m² of houses
1 year
-18.6%
2 years
+12.2%
3 years
+18.6%
4 years
+38.1%
5 years
+41.8%
6 years
+20.7%
7 years
+15.3%
8 years
+60.7%
9 years
+51.2%
10 years
+33.3%
11 years
+27%
ApartmentsEvolution of the price per m² of apartments
1 year
--
2 years
--
3 years
--
4 years
--
5 years
--
6 years
--
7 years
--
8 years
--
9 years
--
10 years
--
11 years
--

Yearly evolution

Median price per m²

Number of transactions

Warning, last year incomplete. Projections made based on the proportions between semesters of the previous year at the departmental/national level and by type of property.

Yearly data

Descending order
Year
Houses
house
Price per m²
Houses
house
transactions
Apartments
apt.
Price per m²
Apartments
apt.
transactions
2025
1 588 €
10
819 €
3
2024
1 951 €
14
310 €
7
2023
1 415 €
29
648 €
8
2022
1 339 €
25
560 €
8
2021
1 150 €
19
754 €
4
2020
1 120 €
23
434 €
6
2019
1 316 €
18
571 €
8
2018
1 377 €
15
276 €
6
2017
988 €
18
594 €
7
2016
1 050 €
9
673 €
11
2015
1 191 €
22
455 €
3
2014
1 250 €
15
605 €
2

Quarterly evolution

Median price per m²

Number of transactions

Analysis

Structure of prices per m²

Values of price percentiles per m² over the periods used for the estimated price of each type of property.

Hérault (34)

Most expensive cities

City
name
Descending orderHouses
house
Price per m²
6 604 €
6 267 €
4 826 €
4 686 €
4 587 €
4 550 €
4 500 €
4 436 €
4 422 €
4 418 €
City
name
Descending orderApartments
apt.
Price per m²
5 318 €
5 204 €
4 953 €
4 917 €
4 496 €
4 294 €
4 238 €
4 214 €
4 145 €

Least expensive cities

City
name
Ascending orderHouses
house
Price per m²
426 €
684 €
848 €
894 €
974 €
1 006 €
1 008 €
City
name
Ascending orderApartments
apt.
Price per m²
267 €
302 €
308 €
337 €
338 €
347 €
448 €
454 €
481 €