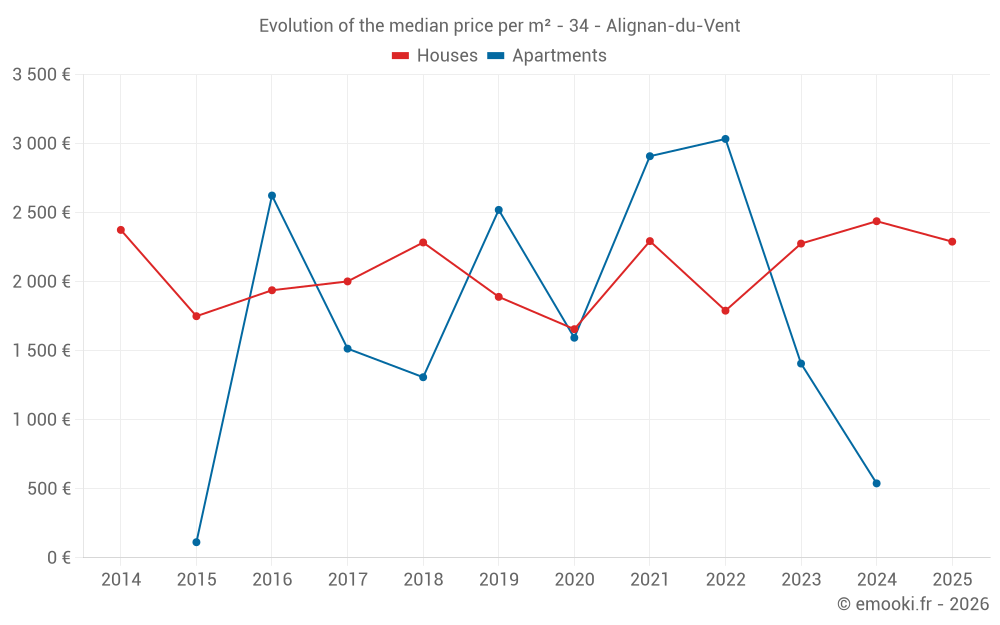
Median price of real estate
in the municipality of Alignan-du-Vent
Houses
2 375 € /m²
Reliability 8/10
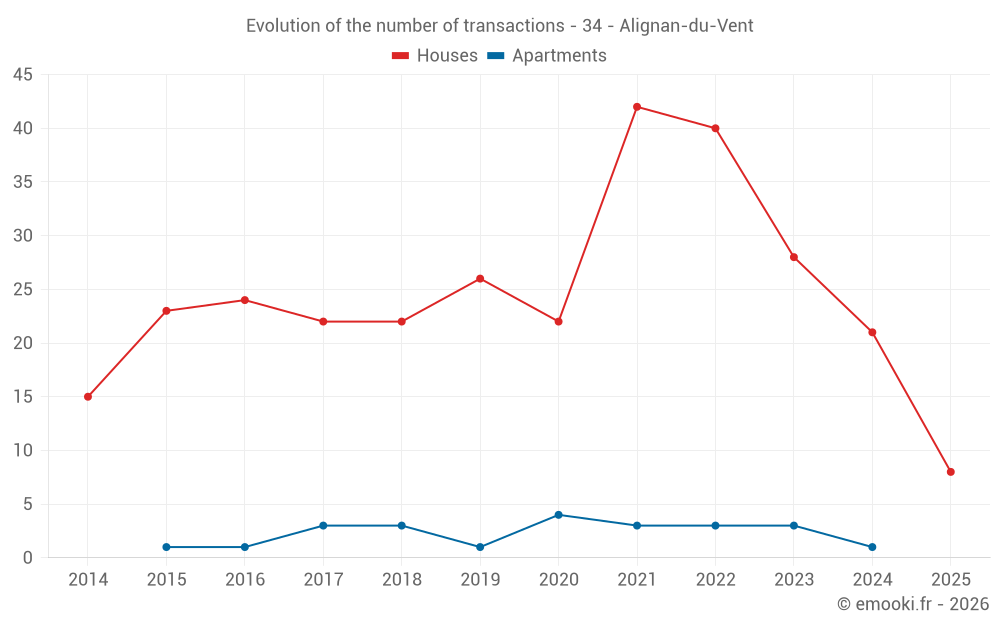
Median price on the 19 transactions of the last 12 months.
from 1 440 to
2 870 € /m²
2 870 € /m²
60% of transactions from the 2nd to the 8th deciles.
Apartments
2 408 € /m²
Reliability 5/10
Median price on the 10 transactions of the last 48 months.
Dwellings
2 375 € /m²
Reliability 8/10
Median price on the 19 transactions of the last 12 months.
from 1 440 to
2 870 € /m²
2 870 € /m²
60% of transactions from the 2nd to the 8th deciles.