emooki
HomePrice mapTransactions
🇬🇧 English🇫🇷 Français🇩🇪 Deutsch🇪🇸 Español🇮🇹 Italiano

Real estate price map


Real estate price map in the municipality of Abeilhan, choose a section to see transactions by parcel.

Hérault (34)

Abeilhan - Real estate price m²

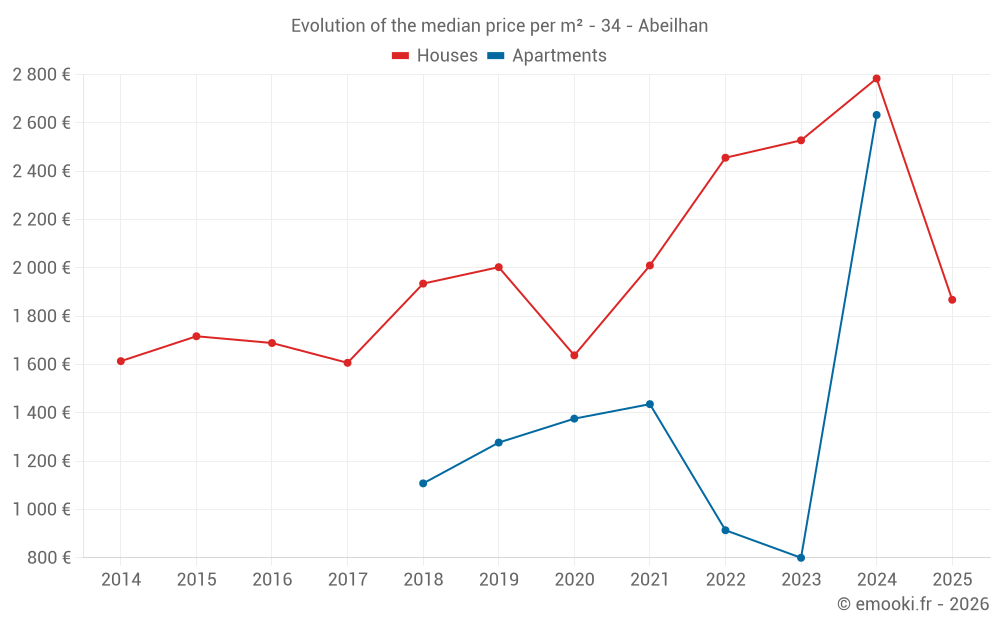
Median price of real estate
in the municipality of Abeilhan

HousesHouses
2 495  /m²
1-23-45-67-89-10
Reliability 7/10
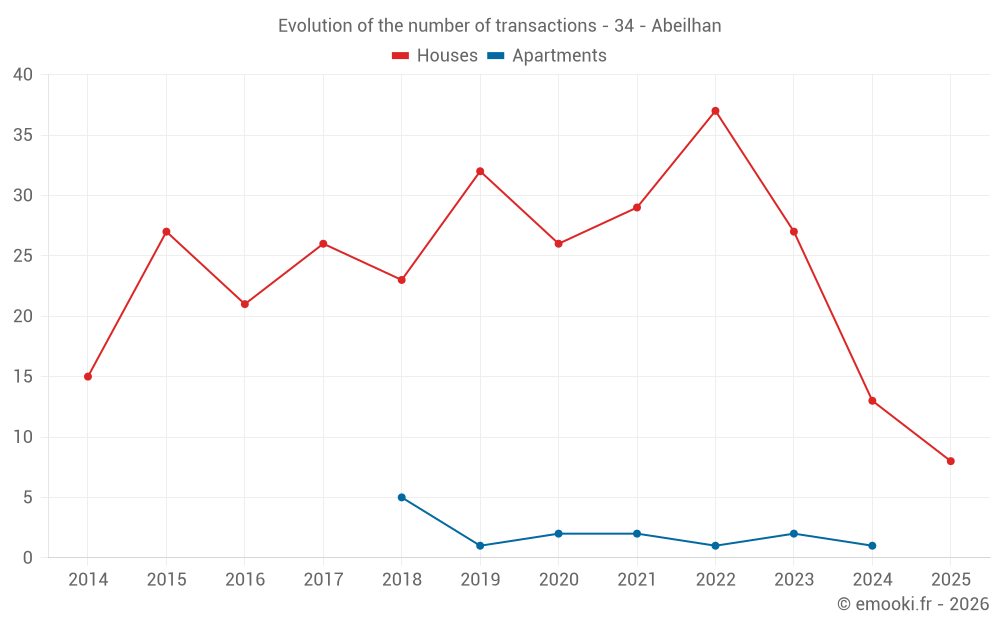
Median price on the 36 transactions of the last 24 months.
from 1 442 to
3 012  /m²
60% of transactions from the 2nd to the 8th deciles.
ApartmentsApartments
1 095  /m²
1-23-45-67-89-10
Reliability 3/10
Median price on the 8 transactions of the last 72 months.
DwellingsDwellings
2 490  /m²
1-23-45-67-89-10
Reliability 7/10
Median price on the 39 transactions of the last 24 months.
from 1 405 to
2 953  /m²
60% of transactions from the 2nd to the 8th deciles.
HousesEvolution of the price per m² of houses since...
1 year
-33%
2 years
-26%
3 years
-24%
4 years
-7.1%
5 years
+14%
6 years
-6.7%
7 years
-3.5%
8 years
+16%
9 years
+11%
10 years
+8.8%
11 years
+16%
The price per m² of houses has decreased by 33% since 1 year, but it has increased by 16% in 8 years.

Yearly evolution

Evolution of the median price per m²

Evolution of the median price per m² - 34 - Abeilhan

Evolution of the number of transactions

Warning, last year incomplete. Projections made based on the proportions between semesters of the previous year at the departmental/national level and by type of property.

Evolution of the number of transactions - 34 - Abeilhan

Yearly data

Descending order
Year
Houses
house
transactions
Houses
house
Price per m²
Apartments
apt.
transactions
Apartments
apt.
Price per m²
2025
8
1 868 
0
--- 
2024
13
2 784 
1
2 633 
2023
27
2 528 
2
800 
2022
37
2 456 
1
914 
2021
29
2 010 
2
1 436 
2020
26
1 638 
2
1 376 
2019
32
2 003 
1
1 277 
2018
23
1 935 
5
1 108 
2017
26
1 607 
0
--- 
2016
21
1 689 
0
--- 
2015
27
1 717 
0
--- 
2014
15
1 614 
0
--- 

Analysis

Structure of prices per m²

Values of price percentiles per m² over the periods used for the estimated price of each type of property.

Structure of transaction amounts

Values of transaction amounts percentiles over the periods used for the estimated price of each type of property.

Transaction amounts and prices per m² by percentile

Ascending order
Percentile
Houses
house
Price per m²
Houses
house
Transaction amount
Apartments
apt.
Price per m²
Apartments
apt.
Transaction amount
10th percentile
1 186 
87 315 
800 
42 388 
20th percentile
1 442 
98 000 
846 
55 875 
30th percentile
1 874 
208 K
915 
73 300 
40th percentile
2 294 
233 K
920 
82 400 
50th percentile
2 495 
262 K
1 095 
90 000 
60th percentile
2 641 
280 K
1 312 
102 K
70th percentile
2 826 
312 K
1 462 
125 K
80th percentile
3 012 
366 K
1 764 
138 K
90th percentile
3 405 
413 K
2 155 
167 K

National and departmental comparison

Evolution of the median price per m² of houses

Evolution of the median price per m² of apartments

Quarterly evolution

Evolution of the median price per m²

Evolution of the number of transactions

Quarterly data

Descending order
Quarter
Houses
house
transactions
Houses
house
Price per m²
Apartments
apt.
transactions
Apartments
apt.
Price per m²
2025 Q2
1
1 033 
0
--- 
2025 Q1
7
2 294 
0
--- 
2024 Q4
3
3 311 
0
--- 
2024 Q3
2
1 874 
1
2 633 
2024 Q2
6
2 593 
0
--- 
2024 Q1
2
2 848 
0
--- 
2023 Q4
8
2 621 
0
--- 
2023 Q3
7
2 125 
2
800 
2023 Q2
6
1 954 
0
--- 
2023 Q1
6
3 068 
0
--- 
2022 Q4
4
1 854 
0
--- 
2022 Q3
8
2 370 
0
--- 
2022 Q2
15
2 456 
1
914 
2022 Q1
10
2 578 
0
--- 
2021 Q4
8
1 641 
0
--- 
2021 Q3
3
846 
1
1 950 
2021 Q2
7
2 010 
0
--- 
2021 Q1
11
2 234 
1
921 
2020 Q4
8
1 638 
1
1 484 
2020 Q3
7
1 503 
0
--- 
2020 Q2
6
1 660 
1
1 269 
2020 Q1
5
1 985 
0
--- 
2019 Q4
9
1 856 
0
--- 
2019 Q3
4
2 231 
0
--- 
2019 Q2
11
1 700 
0
--- 
2019 Q1
8
2 189 
1
1 277 
2018 Q4
7
2 037 
1
942 
2018 Q3
6
1 334 
2
1 041 
2018 Q2
8
1 782 
2
1 296 
2018 Q1
2
2 198 
0
--- 
2017 Q4
5
1 518 
0
--- 
2017 Q3
11
1 614 
0
--- 
2017 Q2
7
1 565 
0
--- 
2017 Q1
3
2 094 
0
--- 
2016 Q4
5
1 608 
0
--- 
2016 Q3
9
1 753 
0
--- 
2016 Q2
4
1 505 
0
--- 
2016 Q1
3
1 471 
0
--- 
2015 Q4
14
1 736 
0
--- 
2015 Q3
6
1 810 
0
--- 
2015 Q2
1
1 849 
0
--- 
2015 Q1
6
1 592 
0
--- 
2014 Q4
6
1 541 
0
--- 
2014 Q3
2
2 014 
0
--- 
2014 Q2
1
1 338 
0
--- 
2014 Q1
6
1 812 
0
--- 

Overview of the latest real estate transactions

The following list is an anonymized overview of the latest transactions. For more details and to find all transactions, please use the map to view transactions by plot or the transaction search page for a search by criteria.

2025-05-23
94 000 
1 033  /m²(91 m²)
Sale
Houses
House
4 rooms
91 m2
Land
169 m2
-Sols
2025-05-20
145 000 
Sale
Land
4910 m2
-Vignes
Land
1500 m2
-Terres
Land
9520 m2
-Vignes
Land
12710 m2
-Vignes
Land
33080 m2
-Vignes
Land
2760 m2
-Vignes
Land
2050 m2
-Vignes
Land
4740 m2
-Vignes
Land
280 m2
-Bois
Land
5210 m2
-Vignes
Land
11815 m2
-Vignes
Land
5560 m2
-Vignes
2025-05-02
1 000 
Sale
Land
810 m2
-Vignes
2025-04-16
9 100 
Sale
Land
3643 m2
-Vignes
Land
3110 m2
-Vignes
2025-04-14
7 000 
Sale
Land
1890 m2
-Vignes
Land
2960 m2
-Vignes
Land
1430 m2
-Vignes
Land
1420 m2
-Vignes
Land
2020 m2
-Vignes
Land
1100 m2
-Vignes
Land
1100 m2
-Vignes
Land
2125 m2
-Vignes
Land
5290 m2
-Vignes
2025-03-31
275 323 
2 294  /m²(120 m²)
Sale
Houses
House
4 rooms
120 m2
1 outbuilding
Land
614 m2
-Sols
2025-03-27
200 000 
1 176  /m²(170 m²)
Sale
Houses
House
6 rooms
170 m2
Land
650 m2
-Sols
2025-03-27
612 750 
3 404  /m²(180 m²)
Sale
Houses
House
6 rooms
180 m2
Land
1874 m2
-Sols
Land
55 m2
-Terrains à bâtir
/Rue
Land
207 m2
-Sols
2025-03-26
90 000 
Sale
Land
24 m2
-Jardins
Land
642 m2
-Vignes
2025-03-18
13 000 
Sale
Land
330 m2
-Vignes
Land
3420 m2
-Vignes
Land
3535 m2
-Vignes
Land
13985 m2
-Vignes
Land
1524 m2
-Vignes
Land
251 m2
-Vignes
2025-03-04
285 190 
2 641  /m²(108 m²)
Sale
Houses
House
4 rooms
108 m2
Land
390 m2
-Sols
2025-02-21
316 000 
2 821  /m²(112 m²)
Sale
Houses
House
5 rooms
112 m2
1 outbuilding
Land
613 m2
-Sols
2025-02-20
80 000 
1 356  /m²(59 m²)
Sale
Houses
House
2 rooms
59 m2
Land
35 m2
-Sols
2025-02-13
80 765 
1 442  /m²(56 m²)
Sale
Houses
House
1 room
16 m2
Land
16 m2
-Sols
Houses
House
3 rooms
40 m2
Land
33 m2
-Sols
2024-12-09
279 305 
3 406  /m²(82 m²)
Sale
Houses
House
4 rooms
82 m2
Land
300 m2
-Sols
2024-12-04
2 400 
Sale
Land
5860 m2
-Vignes
2024-12-03
8 000 
Sale
Land
61 m2
-Terrains à bâtir
/Rue
2024-11-27
530 000 
3 292  /m²(161 m²)
Sale
Houses
House
5 rooms
161 m2
1 outbuilding
Land
843 m2
-Sols
Land
1023 m2
-Terres
2024-10-17
221 190 
2 910  /m²(76 m²)
Sale
Houses
House
4 rooms
76 m2
Land
274 m2
-Sols
2024-10-01
450 250 
3 311  /m²(136 m²)
Sale
Houses
House
5 rooms
136 m2
Land
410 m2
-Sols
Land
336 m2
-Jardins
Land
5 m2
-Sols
471 transactions listed in the municipality

Hérault (34)

Most expensive cities

City
name
Descending orderHouses
house
Price per m²
6 604 
6 267 
4 826 
4 550 
4 500 
4 436 
4 422 
4 418 
City
name
Descending orderApartments
apt.
Price per m²
5 318 
4 953 
4 917 
4 496 
4 294 
4 214 
4 145 

Least expensive cities

City
name
Ascending orderHouses
house
Price per m²
426 
684 
848 
1 008 
City
name
Ascending orderApartments
apt.
Price per m²
267 
302 
308 
337 
338 
448 
454 
481