Real estate price map
Real estate price map in the municipality of Sainte-Cécile-d'Andorge, choose a section to see transactions by parcel.
Gard (30)
Price per m² in Sainte-Cécile-d'Andorge
Median price of real estate
in the municipality of Sainte-Cécile-d'Andorge
Houses
1 696 € /m²
Reliability 6/10
Median price on the 16 transactions of the last 36 months.
from 1 316 to
2 159 € /m²
2 159 € /m²
60% of transactions from the 2nd to the 8th deciles.
Apartments
641 € /m²
Reliability 4/10
Median price on the 9 transactions of the last 60 months.
Dwellings
1 679 € /m²
Reliability 6/10
Median price on the 21 transactions of the last 36 months.
from 1 117 to
2 091 € /m²
2 091 € /m²
60% of transactions from the 2nd to the 8th deciles.
Yearly evolution
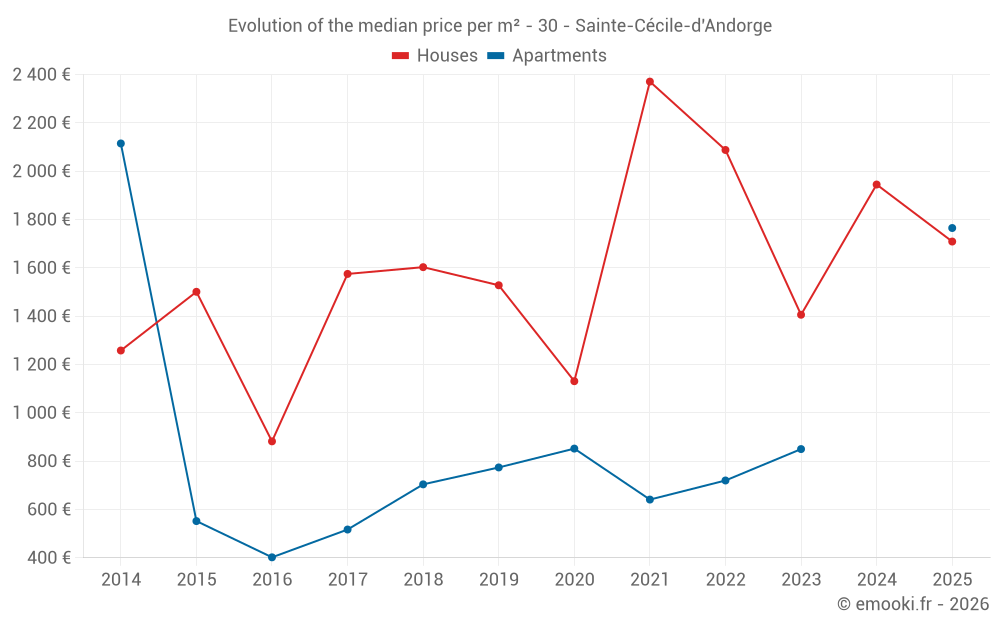
Evolution of the median price per m²
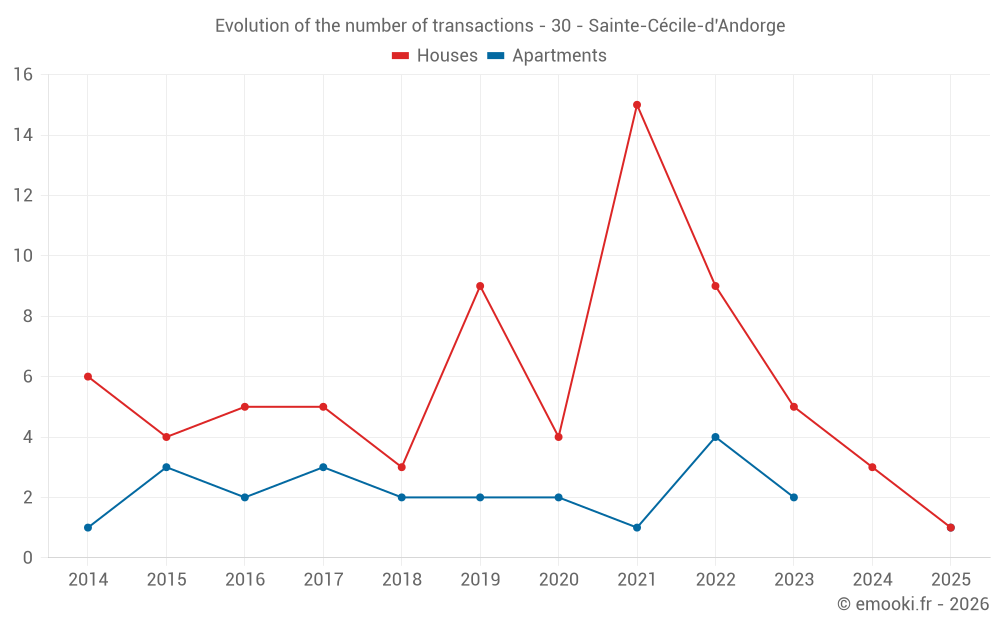
Evolution of the number of transactions
Warning, last year incomplete. Projections made based on the proportions between semesters of the previous year at the departmental/national level and by type of property.
Yearly data
Year
house
transactions
transactions
house
Price per m²
Price per m²
apt.
transactions
transactions
apt.
Price per m²
Price per m²
2025
1
1 709 €
1
1 765 €
2024
3
1 945 €
0
--- €
2023
5
1 406 €
2
850 €
2022
9
2 088 €
4
720 €
2021
15
2 371 €
1
641 €
2020
4
1 131 €
2
852 €
2019
9
1 528 €
2
774 €
2018
3
1 603 €
2
704 €
2017
5
1 575 €
3
517 €
2016
5
882 €
2
402 €
2015
4
1 501 €
3
552 €
2014
6
1 258 €
1
2 115 €
Analysis
Structure of prices per m²
Values of price percentiles per m² over the periods used for the estimated price of each type of property.
Structure of transaction amounts
Values of transaction amounts percentiles over the periods used for the estimated price of each type of property.
Transaction amounts and prices per m² by percentile
Percentile
house
Price per m²
Price per m²
house
Transaction amount
Transaction amount
apt.
Price per m²
Price per m²
apt.
Transaction amount
Transaction amount
10th percentile
1 176 €
67 500 €
367 €
16 100 €
20th percentile
1 316 €
75 000 €
474 €
24 362 €
30th percentile
1 434 €
98 000 €
522 €
30 362 €
40th percentile
1 679 €
113 K€
587 €
38 000 €
50th percentile
1 696 €
134 K€
641 €
50 000 €
60th percentile
1 945 €
207 K€
890 €
54 800 €
70th percentile
2 090 €
211 K€
1 057 €
117 K€
80th percentile
2 159 €
228 K€
1 382 €
214 K€
90th percentile
2 435 €
243 K€
1 972 €
302 K€
National and departmental comparison
Evolution of the median price per m² of houses
Evolution of the median price per m² of apartments
Quarterly evolution
Evolution of the median price per m²
Evolution of the number of transactions
Quarterly data
Quarter
house
transactions
transactions
house
Price per m²
Price per m²
apt.
transactions
transactions
apt.
Price per m²
Price per m²
2025 Q1
1
1 709 €
1
1 765 €
2024 Q4
2
1 814 €
0
--- €
2024 Q3
1
7 948 €
0
--- €
2023 Q4
1
1 462 €
0
--- €
2023 Q3
3
1 406 €
0
--- €
2023 Q2
1
1 236 €
1
1 127 €
2023 Q1
0
--- €
1
574 €
2022 Q4
5
2 091 €
2
720 €
2022 Q3
2
1 702 €
0
--- €
2022 Q2
2
2 126 €
0
--- €
2022 Q1
0
--- €
2
1 406 €
2021 Q4
6
2 560 €
0
--- €
2021 Q3
2
2 366 €
1
641 €
2021 Q2
2
2 065 €
0
--- €
2021 Q1
5
1 978 €
0
--- €
2020 Q4
1
1 776 €
1
455 €
2020 Q3
2
1 115 €
0
--- €
2020 Q2
1
603 €
0
--- €
2020 Q1
0
--- €
1
1 250 €
2019 Q4
5
1 556 €
0
--- €
2019 Q3
2
982 €
1
1 333 €
2019 Q2
1
1 528 €
0
--- €
2019 Q1
1
1 684 €
1
216 €
2018 Q4
2
1 619 €
0
--- €
2018 Q3
0
--- €
1
400 €
2018 Q1
1
1 603 €
1
1 009 €
2017 Q4
2
1 962 €
0
--- €
2017 Q3
2
1 158 €
2
519 €
2017 Q1
1
1 575 €
1
194 €
2016 Q4
1
1 406 €
0
--- €
2016 Q3
0
--- €
2
402 €
2016 Q2
2
312 €
0
--- €
2016 Q1
2
1 726 €
0
--- €
2015 Q4
0
--- €
2
430 €
2015 Q3
2
1 275 €
1
588 €
2015 Q2
2
1 552 €
0
--- €
2014 Q3
4
1 316 €
0
--- €
2014 Q2
1
1 300 €
1
2 115 €
2014 Q1
1
1 215 €
0
--- €
Overview of the latest real estate transactions
The following list is an anonymized overview of the latest transactions. For more details and to find all transactions, please use the map to view transactions by plot or the transaction search page for a search by criteria.
2025-03-21
300 000 €1 765 € /m²(170 m²)
Sale
Apartment
2 rooms
55 m2
Apartment
6 rooms
115 m2
1 outbuilding
Land
1488 m2
-Sols
Land
3945 m2
-Prés
Land
6605 m2
-Vergers
/CHAT
Land
25 m2
-Sols
Land
380 m2
-Sols
Land
4883 m2
-Terres
2025-01-31
131 600 €1 709 € /m²(77 m²)
Sale
House
3 rooms
77 m2
Land
1795 m2
-Futaies résineuses
/Pins
Land
500 m2
-Sols
2024-12-10
101 000 €1 683 € /m²(60 m²)
Sale
House
3 rooms
60 m2
1 outbuilding
Land
298 m2
-Sols
Land
1039 m2
-Prés
2024-11-21
112 835 €1 945 € /m²(58 m²)
Sale
House
1 room
58 m2
1 outbuilding
Land
350 m2
-Sols
Land
993 m2
-Terres
2024-09-24
1 000 €23 € /m²(44 m²)
Exchange
Apartment
2 rooms
44 m2
5 outbuildings
2024-08-22
5 000 €Sale
Land
5730 m2
-Futaies résineuses
/Pins
Land
1640 m2
-Futaies résineuses
/Pins
Land
6000 m2
-Taillis simples
Land
680 m2
-Landes
Land
448 m2
-Vergers
/CHAT
Land
232 m2
-Terres
Land
16323 m2
-Futaies résineuses
/Pins
Land
10670 m2
-Futaies résineuses
/Pins
2024-07-16
206 660 €7 948 € /m²(26 m²)
Sale
House
1 room
26 m2
Land
51 m2
-Sols
Land
409 m2
-Sols
Land
23375 m2
-Futaies résineuses
/Pins
Land
1030 m2
-Vignes
Land
44 m2
-Landes
Land
1105 m2
-Landes
Land
997 m2
-Jardins
/Jardin potager
Land
1153 m2
-Jardins
/Jardin potager
2024-06-28
7 800 €Sale
Land
701 m2
-Jardins
/Jardin potager
Land
4505 m2
-Taillis simples
2024-05-28
1 €Exchange
Land
174 m2
-Futaies résineuses
/Pins
Land
7 m2
-Terres
Land
74 m2
-Terres
2024-03-27
1 €Sale
Land
253 m2
-Futaies résineuses
/Pins
2024-03-27
1 €Sale
Land
851 m2
-Futaies résineuses
/Pins
Land
256 m2
-Prés
Land
108 m2
-Sols
Land
1752 m2
-Prés
Land
2053 m2
-Taillis simples
Land
321 m2
-Taillis simples
Land
673 m2
-Taillis simples
Land
6253 m2
-Taillis simples
2023-12-14
95 000 €1 462 € /m²(65 m²)
Sale
House
3 rooms
65 m2
Land
261 m2
-Sols
Land
54 m2
-Sols
2023-10-17
4 500 €Sale
Land
1595 m2
-Vergers
/CHAT
2023-09-21
60 000 €750 € /m²(80 m²)
Sale
House
2 rooms
24 m2
Land
6250 m2
-Vergers
/CHAT
Land
100 m2
-Sols
Apartment
2 rooms
27 m2
2 outbuildings
House
1 room
29 m2
Land
720 m2
-Sols
Land
1000 m2
-Terres
2 outbuildings
Land
28 m2
-Sols
1 outbuilding
Land
89 m2
-Sols
Land
6800 m2
-Taillis simples
Land
15675 m2
-Taillis simples
Land
14 m2
-Sols
Land
171 m2
-Vignes
Land
4750 m2
-Taillis simples
Land
1265 m2
-Sols
Land
297 m2
-Jardins
/Jardin potager
Land
164 m2
-Sols
Land
135 m2
-Sols
Land
70 m2
-Jardins
/Jardin potager
Land
697 m2
-Vignes
2023-09-08
136 000 €2 159 € /m²(63 m²)
Sale
House
3 rooms
63 m2
Land
310 m2
-Sols
Land
1159 m2
-Sols
Land
20 m2
-Sols
Land
900 m2
-Vignes
Land
5475 m2
-Prés
Land
3360 m2
-Futaies résineuses
/Pins
2023-09-06
5 000 €Sale
Land
10900 m2
-Futaies résineuses
/Pins
Land
14951 m2
-Futaies résineuses
/Pins
Land
2499 m2
-Taillis simples
Land
202 m2
-Taillis simples
Land
13840 m2
-Taillis simples
Land
1413 m2
-Landes
Land
6865 m2
-Taillis simples
Land
9590 m2
-Taillis simples
Land
2982 m2
-Landes
Land
16400 m2
-Futaies résineuses
/Pins
Land
1200 m2
-Prés
Land
14030 m2
-Futaies résineuses
/Pins
Land
11560 m2
-Futaies résineuses
/Pins
Land
2950 m2
-Taillis simples
Land
570 m2
-Taillis simples
Land
6430 m2
-Taillis simples
Land
6160 m2
-Taillis simples
2023-07-31
262 900 €1 406 € /m²(187 m²)
Sale
House
5 rooms
187 m2
1 outbuilding
Land
490 m2
-Sols
Land
1735 m2
-Prés
Land
2095 m2
-Futaies résineuses
/Pins
2023-07-03
1 €Sale
Land
28 m2
-Sols
2023-06-16
310 000 €1 127 € /m²(275 m²)
Sale
Apartment
5 rooms
110 m2
Apartment
2 rooms
45 m2
Apartment
4 rooms
120 m2
1 outbuilding
Land
540 m2
-Sols
Land
978 m2
-Vignes
2023-05-09
1 €Sale
Land
59 m2
-Terres
168 transactions listed in the municipality
Compare with neighboring municipalities
City
name
name
house
Price per m²
Price per m²
apt.
Price per m²
Price per m²
City information
Zip code
- 30110 STE CECILE D ANDORGE
Data source & update
- Latest publication of the property value request (DVF) database made available by the DGFiP on October 19, 2025, covering transactions up to 06/30/2025:
- Administrative/cadastral division as of September 1, 2025, and municipal movements as of January 1, 2025: