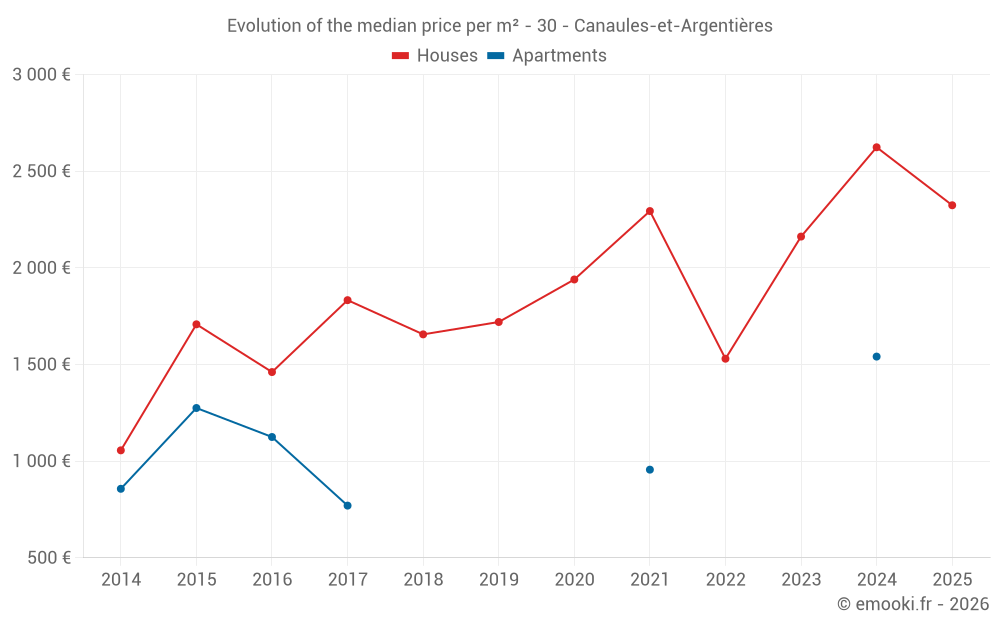
Median price of real estate
in the municipality of Canaules-et-Argentières
Houses
2 331 € /m²
Reliability 7/10
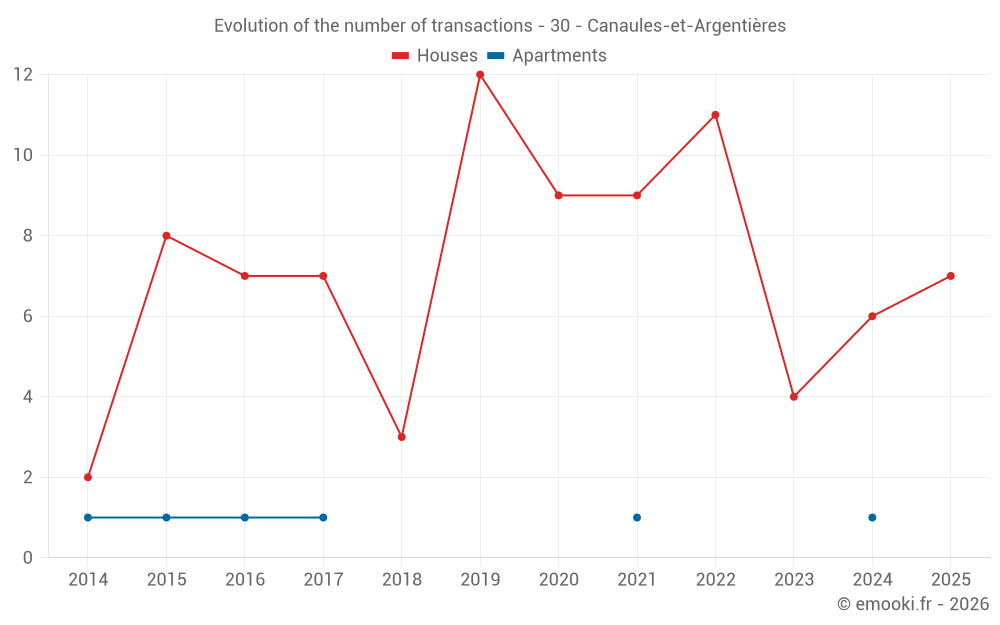
Median price on the 16 transactions of the last 24 months.
from 1 551 to
2 811 € /m²
2 811 € /m²
60% of transactions from the 2nd to the 8th deciles.
Apartments
1 040 € /m²
Reliability 1/10
Median price on the 4 transactions of the last 120 months.
Dwellings
2 324 € /m²
Reliability 7/10
Median price on the 17 transactions of the last 24 months.
from 1 543 to
2 797 € /m²
2 797 € /m²
60% of transactions from the 2nd to the 8th deciles.