emooki
HomePrice mapTransactions
🇬🇧 English🇫🇷 Français🇩🇪 Deutsch🇪🇸 Español🇮🇹 Italiano

Real estate price map


Real estate price map in the municipality of Ouessant, choose a section to see transactions by parcel.

Finistère (29)

Ouessant - Real estate price m²

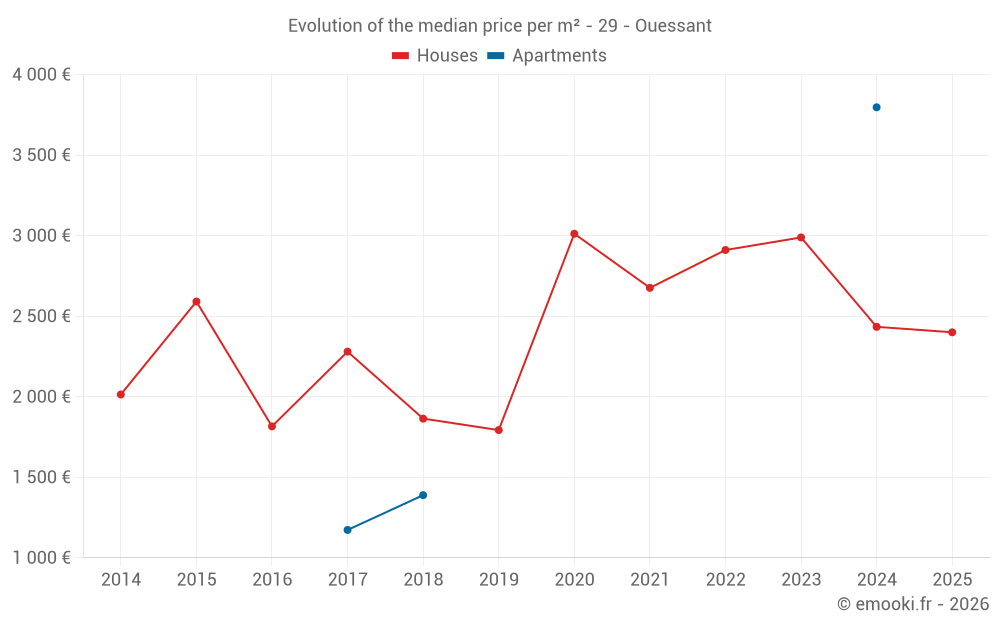
Median price of real estate
in the municipality of Ouessant

HousesHouses
2 632  /m²
1-23-45-67-89-10
Reliability 7/10
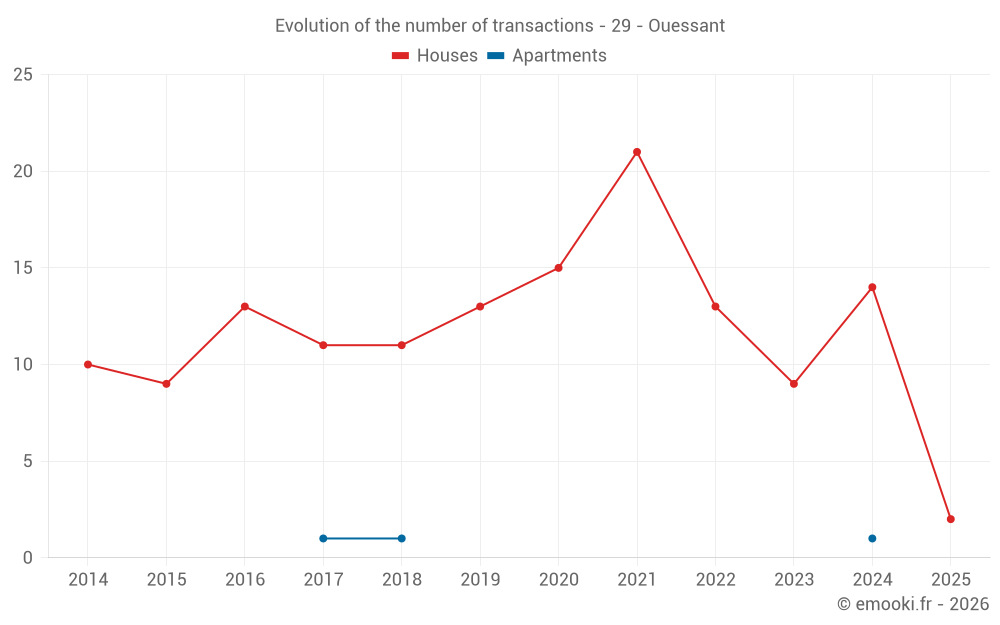
Median price on the 23 transactions of the last 24 months.
from 1 887 to
3 480  /m²
60% of transactions from the 2nd to the 8th deciles.
ApartmentsApartments
1 389  /m²
1-23-45-67-89-10
Reliability 1/10
Median price on the 3 transactions of the last 120 months.
DwellingsDwellings
2 636  /m²
1-23-45-67-89-10
Reliability 7/10
Median price on the 24 transactions of the last 24 months.
from 1 956 to
3 666  /m²
60% of transactions from the 2nd to the 8th deciles.

Yearly evolution

Evolution of the median price per m²

Evolution of the median price per m² - 29 - Ouessant

Evolution of the number of transactions

Warning, last year incomplete. Projections made based on the proportions between semesters of the previous year at the departmental/national level and by type of property.

Evolution of the number of transactions - 29 - Ouessant

Yearly data

Descending order
Year
Houses
house
transactions
Houses
house
Price per m²
Apartments
apt.
transactions
Apartments
apt.
Price per m²
2025
2
2 400 
0
--- 
2024
14
2 434 
1
3 797 
2023
9
2 989 
0
--- 
2022
13
2 911 
0
--- 
2021
21
2 676 
0
--- 
2020
15
3 012 
0
--- 
2019
13
1 793 
0
--- 
2018
11
1 864 
1
1 389 
2017
11
2 280 
1
1 173 
2016
13
1 816 
0
--- 
2015
9
2 591 
0
--- 
2014
10
2 014 
0
--- 

Analysis

Structure of prices per m²

Values of price percentiles per m² over the periods used for the estimated price of each type of property.

Structure of transaction amounts

Values of transaction amounts percentiles over the periods used for the estimated price of each type of property.

Transaction amounts and prices per m² by percentile

Ascending order
Percentile
Houses
house
Price per m²
Houses
house
Transaction amount
Apartments
apt.
Price per m²
Apartments
apt.
Transaction amount
10th percentile
1 682 
161 K
1 216 
44 300 
20th percentile
1 887 
174 K
1 259 
63 600 
30th percentile
2 253 
180 K
1 303 
82 900 
40th percentile
2 366 
198 K
1 346 
102 K
50th percentile
2 632 
202 K
1 389 
122 K
60th percentile
2 751 
238 K
1 871 
135 K
70th percentile
3 014 
262 K
2 352 
149 K
80th percentile
3 480 
279 K
2 834 
163 K
90th percentile
4 148 
321 K
3 315 
176 K

National and departmental comparison

Evolution of the median price per m² of houses

Evolution of the median price per m² of apartments

Quarterly evolution

Evolution of the median price per m²

Evolution of the number of transactions

Quarterly data

Descending order
Quarter
Houses
house
transactions
Houses
house
Price per m²
Apartments
apt.
transactions
Apartments
apt.
Price per m²
2025 Q2
1
2 096 
0
--- 
2025 Q1
1
2 703 
0
--- 
2024 Q4
5
2 368 
0
--- 
2024 Q3
3
2 195 
0
--- 
2024 Q2
4
2 792 
0
--- 
2024 Q1
2
3 203 
1
3 797 
2023 Q4
3
4 208 
0
--- 
2023 Q3
4
2 190 
0
--- 
2023 Q2
2
2 778 
0
--- 
2022 Q4
4
3 004 
0
--- 
2022 Q3
1
3 576 
0
--- 
2022 Q2
1
2 083 
0
--- 
2022 Q1
7
2 911 
0
--- 
2021 Q4
4
2 538 
0
--- 
2021 Q3
7
2 817 
0
--- 
2021 Q2
2
5 982 
0
--- 
2021 Q1
8
2 571 
0
--- 
2020 Q4
4
3 237 
0
--- 
2020 Q3
6
2 970 
0
--- 
2020 Q2
1
3 012 
0
--- 
2020 Q1
4
2 478 
0
--- 
2019 Q4
2
3 368 
0
--- 
2019 Q3
4
1 120 
0
--- 
2019 Q2
5
2 720 
0
--- 
2019 Q1
2
1 677 
0
--- 
2018 Q4
2
2 243 
1
1 389 
2018 Q3
4
2 680 
0
--- 
2018 Q2
1
1 100 
0
--- 
2018 Q1
4
1 504 
0
--- 
2017 Q4
5
2 151 
0
--- 
2017 Q3
3
2 472 
1
1 173 
2017 Q2
2
1 950 
0
--- 
2017 Q1
1
2 381 
0
--- 
2016 Q4
4
2 006 
0
--- 
2016 Q3
3
2 597 
0
--- 
2016 Q2
3
1 489 
0
--- 
2016 Q1
3
1 579 
0
--- 
2015 Q4
5
2 080 
0
--- 
2015 Q1
4
2 596 
0
--- 
2014 Q4
3
2 000 
0
--- 
2014 Q3
1
2 500 
0
--- 
2014 Q2
2
1 490 
0
--- 
2014 Q1
4
1 869 
0
--- 

Overview of the latest real estate transactions

The following list is an anonymized overview of the latest transactions. For more details and to find all transactions, please use the map to view transactions by plot or the transaction search page for a search by criteria.

2025-05-05
318 615 
2 096  /m²(152 m²)
Sale
Houses
House
3 rooms
70 m2
Houses
House
4 rooms
82 m2
Land
518 m2
-Sols
Land
623 m2
-Terres
2025-04-23
90 
Sale
Land
181 m2
-Landes
2025-03-31
35 561 
Sale
Land
827 m2
-Terres
2025-03-27
200 000 
2 703  /m²(74 m²)
Sale
Houses
House
4 rooms
74 m2
3 outbuildings
Land
305 m2
-Sols
Land
35 m2
-Terres
Land
216 m2
-Jardins
Land
117 m2
-Terres
Land
219 m2
-Terres
2025-03-07
2 425 
Sale
Land
485 m2
-Landes
2025-02-26
70 000 
Sale
Land
590 m2
-Terrains à bâtir
2024-12-27
46 200 
Sale
2 outbuildings
Land
200 m2
-Sols
Land
570 m2
-Jardins
2024-12-16
54 985 
Sale
1 outbuilding
Land
431 m2
-Sols
Land
1140 m2
-Terrains d'agrément
2024-12-13
270 000 
3 333  /m²(81 m²)
Sale
Houses
House
4 rooms
81 m2
1 outbuilding
Land
340 m2
-Sols
Land
825 m2
-Terres
Land
384 m2
-Landes
Land
141 m2
-Jardins
2024-12-10
3 000 
Sale
Land
201 m2
-Jardins
2024-12-05
220 000 
2 558  /m²(86 m²)
Sale
Commercial property
86 m2
2024-11-07
2 740 
Sale
Land
274 m2
-Landes
2024-10-30
26 500 
Sale
Land
233 m2
-Landes
Land
425 m2
-Jardins
Land
34 m2
-Sols
2024-10-27
1 000 
Sale
Land
206 m2
-Terres
2024-10-25
70 000 
909  /m²(77 m²)
Sale
Houses
House
2 rooms
23 m2
1 outbuilding
Land
475 m2
-Sols
Houses
House
3 rooms
54 m2
1 outbuilding
Land
665 m2
-Sols
2024-10-18
235 000 
3 052  /m²(77 m²)
Sale
Houses
House
4 rooms
77 m2
Land
805 m2
-Sols
Land
494 m2
-Terres
2024-10-15
180 000 
2 368  /m²(76 m²)
Sale
Houses
House
4 rooms
76 m2
1 outbuilding
Land
396 m2
-Sols
Land
135 m2
-Sols
Land
892 m2
-Terres
Land
281 m2
-Terres
2024-10-11
174 000 
1 626  /m²(107 m²)
Sale
Houses
House
5 rooms
107 m2
3 outbuildings
Land
193 m2
-Sols
Land
125 m2
-Landes
Land
376 m2
-Terres
Land
240 m2
-Sols
Land
410 m2
-Sols
2024-09-25
1 200 
Sale
Land
353 m2
-Terres
2024-09-24
180 000 
2 195  /m²(82 m²)
Sale
Houses
House
3 rooms
82 m2
1 outbuilding
Land
232 m2
-Sols
Land
375 m2
-Landes
Land
185 m2
-Landes
Land
183 m2
-Terres
Land
370 m2
-Terres
Land
202 m2
-Terres
Land
228 m2
-Sols
Land
308 m2
-Jardins
Land
243 m2
-Landes
Land
202 m2
-Terres
Land
178 m2
-Jardins
275 transactions listed in the municipality

Finistère (29)

Most expensive cities

City
name
Descending orderHouses
house
Price per m²
3 989 
3 766 
3 461 
3 428 
3 146 
3 102 
3 044 
2 965 
City
name
Descending orderApartments
apt.
Price per m²
4 592 
4 260 
4 097 
3 933 
3 778 
3 210 
3 200 
3 066 

Least expensive cities

City
name
Ascending orderHouses
house
Price per m²
750 
792 
793 
830 
878 
889 
934 
935 
943 
City
name
Ascending orderApartments
apt.
Price per m²
200 
232 
312 
320 
339 
365 
388 
399 
415