Real estate price map
Real estate price map in the municipality of Vaux-et-Chantegrue, choose a section to see transactions by parcel.
Doubs (25)
Price per m² in Vaux-et-Chantegrue
Median price of real estate
in the municipality of Vaux-et-Chantegrue
Houses
3 199 € /m²
Reliability 6/10
Median price on the 13 transactions of the last 36 months.
from 2 896 to
3 666 € /m²
3 666 € /m²
60% of transactions from the 2nd to the 8th deciles.
Apartments
2 290 € /m²
Reliability 5/10
Median price on the 14 transactions of the last 48 months.
from 1 682 to
2 940 € /m²
2 940 € /m²
60% of transactions from the 2nd to the 8th deciles.
Dwellings
3 008 € /m²
Reliability 6/10
Median price on the 19 transactions of the last 36 months.
from 2 294 to
3 548 € /m²
3 548 € /m²
60% of transactions from the 2nd to the 8th deciles.
Yearly evolution
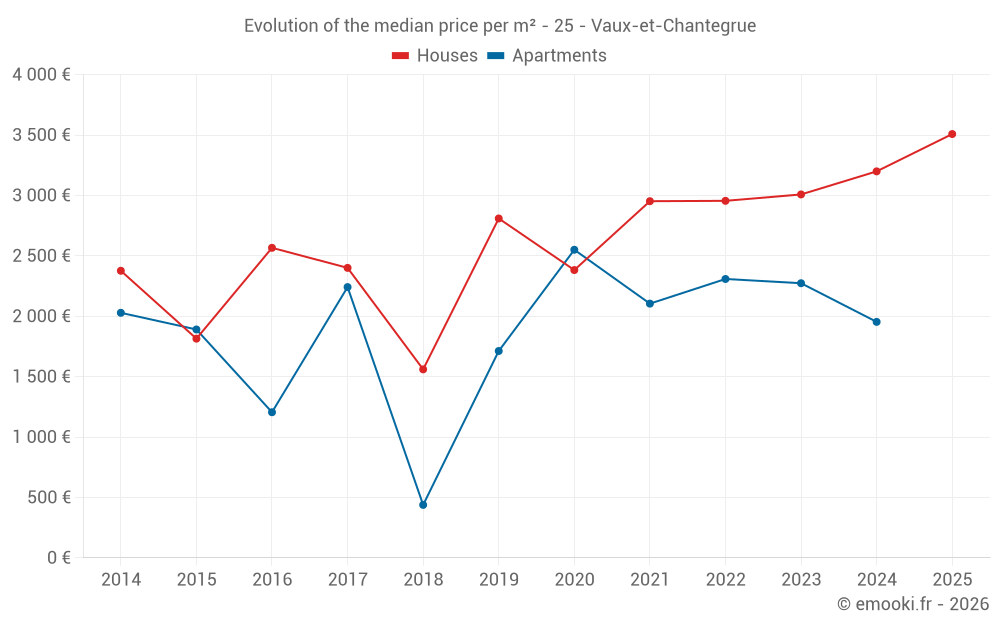
Evolution of the median price per m²
Evolution of the number of transactions
Warning, last year incomplete. Projections made based on the proportions between semesters of the previous year at the departmental/national level and by type of property.
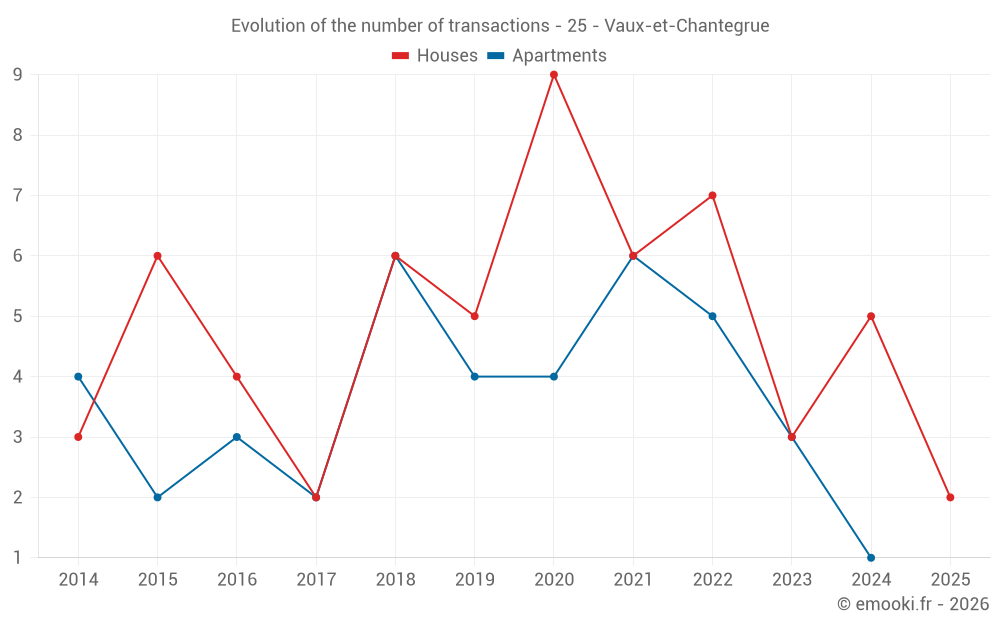
Yearly data
Year
house
transactions
transactions
house
Price per m²
Price per m²
apt.
transactions
transactions
apt.
Price per m²
Price per m²
2025
2
3 508 €
0
--- €
2024
5
3 199 €
1
1 953 €
2023
3
3 008 €
3
2 273 €
2022
7
2 955 €
5
2 308 €
2021
6
2 952 €
6
2 104 €
2020
9
2 382 €
4
2 550 €
2019
5
2 809 €
4
1 712 €
2018
6
1 560 €
6
438 €
2017
2
2 400 €
2
2 241 €
2016
4
2 566 €
3
1 205 €
2015
6
1 814 €
2
1 890 €
2014
3
2 376 €
4
2 028 €
Analysis
Structure of prices per m²
Values of price percentiles per m² over the periods used for the estimated price of each type of property.
Structure of transaction amounts
Values of transaction amounts percentiles over the periods used for the estimated price of each type of property.
Transaction amounts and prices per m² by percentile
Percentile
house
Price per m²
Price per m²
house
Transaction amount
Transaction amount
apt.
Price per m²
Price per m²
apt.
Transaction amount
Transaction amount
10th percentile
2 850 €
321 K€
1 425 €
52 250 €
20th percentile
2 896 €
341 K€
1 682 €
57 830 €
30th percentile
2 987 €
373 K€
1 934 €
59 805 €
40th percentile
3 050 €
395 K€
2 055 €
85 000 €
50th percentile
3 199 €
400 K€
2 290 €
126 K€
60th percentile
3 290 €
415 K€
2 415 €
169 K€
70th percentile
3 548 €
440 K€
2 602 €
248 K€
80th percentile
3 666 €
452 K€
2 940 €
255 K€
90th percentile
3 754 €
462 K€
3 254 €
348 K€
National and departmental comparison
Evolution of the median price per m² of houses
Evolution of the median price per m² of apartments
Quarterly evolution
Evolution of the median price per m²
Evolution of the number of transactions
Quarterly data
Quarter
house
transactions
transactions
house
Price per m²
Price per m²
apt.
transactions
transactions
apt.
Price per m²
Price per m²
2025 Q2
1
3 773 €
0
--- €
2025 Q1
1
3 243 €
0
--- €
2024 Q4
0
--- €
1
1 953 €
2024 Q3
4
3 338 €
0
--- €
2024 Q2
1
2 848 €
0
--- €
2023 Q4
1
3 800 €
0
--- €
2023 Q3
2
2 568 €
1
1 369 €
2023 Q2
0
--- €
1
2 273 €
2023 Q1
0
--- €
1
3 225 €
2022 Q4
2
3 356 €
2
2 529 €
2022 Q3
1
2 955 €
0
--- €
2022 Q2
2
2 296 €
2
1 539 €
2022 Q1
2
2 272 €
1
3 676 €
2021 Q4
1
3 836 €
1
2 442 €
2021 Q3
1
2 491 €
4
2 176 €
2021 Q2
0
--- €
1
1 464 €
2021 Q1
4
2 952 €
0
--- €
2020 Q4
1
3 382 €
0
--- €
2020 Q3
4
2 356 €
1
1 111 €
2020 Q2
2
1 690 €
2
2 557 €
2020 Q1
2
1 613 €
1
2 600 €
2019 Q4
2
2 914 €
0
--- €
2019 Q3
1
2 962 €
2
1 948 €
2019 Q2
1
2 809 €
2
1 522 €
2019 Q1
1
1 807 €
0
--- €
2018 Q4
1
3 989 €
3
374 €
2018 Q3
1
1 333 €
2
1 328 €
2018 Q2
3
1 653 €
0
--- €
2018 Q1
1
524 €
1
1 840 €
2017 Q4
1
2 087 €
1
2 301 €
2017 Q3
1
2 713 €
1
2 181 €
2016 Q4
2
2 621 €
2
1 088 €
2016 Q2
2
2 398 €
1
1 205 €
2015 Q4
2
2 297 €
0
--- €
2015 Q3
2
1 886 €
1
1 824 €
2015 Q2
1
1 544 €
1
1 955 €
2015 Q1
1
1 214 €
0
--- €
2014 Q4
0
--- €
1
1 429 €
2014 Q3
0
--- €
2
2 134 €
2014 Q2
2
2 890 €
1
2 288 €
2014 Q1
1
1 295 €
0
--- €
Overview of the latest real estate transactions
The following list is an anonymized overview of the latest transactions. For more details and to find all transactions, please use the map to view transactions by plot or the transaction search page for a search by criteria.
2025-05-23
464 030 €3 773 € /m²(123 m²)
Sale
House
4 rooms
123 m2
Land
598 m2
-Sols
2025-03-28
113 000 €Sale
Land
640 m2
-Terrains à bâtir
2025-02-20
375 €Sale
Land
122 m2
-Sols
2025-02-13
121 000 €Sale
Land
663 m2
-Terrains à bâtir
2025-01-15
434 500 €3 243 € /m²(134 m²)
Sale
House
7 rooms
134 m2
Land
906 m2
-Sols
2024-12-26
97 000 €Sale
Land
587 m2
-Terrains à bâtir
2024-12-19
250 000 €1 953 € /m²(128 m²)
Sale
Apartment
3 rooms
65 m2
Apartment
3 rooms
63 m2
3 outbuildings
Land
1227 m2
-Terrains d'agrément
Land
1000 m2
-Sols
2024-09-30
320 000 €3 478 € /m²(92 m²)
Sale
House
4 rooms
92 m2
2 outbuildings
Land
1000 m2
-Sols
Land
3940 m2
-Prés
Land
2800 m2
-Terres
2024-09-19
400 000 €2 857 € /m²(140 m²)
Sale
House
4 rooms
140 m2
Land
747 m2
-Sols
2024-09-06
454 286 €3 199 € /m²(142 m²)
Sale
House
5 rooms
142 m2
Land
680 m2
-Sols
2024-08-28
1 015 €Sale
Land
1397 m2
-Terres
Land
1985 m2
-Terres
2024-07-25
588 215 €3 676 € /m²(160 m²)
Sale
House
4 rooms
160 m2
1 outbuilding
Land
870 m2
-Sols
2024-06-21
18 034 €Sale
Land
1060 m2
-Terres
Land
5120 m2
-Terres
Land
6383 m2
-Terres
Land
19147 m2
-Terres
Land
28940 m2
-Terres
Land
3000 m2
-Prés
Land
143 m2
-Terres
2024-06-11
364 500 €2 848 € /m²(128 m²)
Sale
House
6 rooms
128 m2
1 outbuilding
Land
705 m2
-Sols
2024-04-18
1 €Sale
Land
4348 m2
-Sols
2024-03-19
355 000 €1 300 € /m²(273 m²)
2 910 € /m²(122 m²)
Sale
House
6 rooms
122 m2
Commercial property
151 m2
1 outbuilding
2024-03-19
249 000 €912 € /m²(273 m²)
2 041 € /m²(122 m²)
Sale
House
6 rooms
122 m2
Commercial property
151 m2
1 outbuilding
2024-03-19
100 000 €662 € /m²(151 m²)
Sale
Commercial property
151 m2
Land
416 m2
-Sols
2024-03-14
6 243 €Sale
Land
87 m2
-Sols
2024-01-17
1 500 €Sale
Land
3540 m2
-Terres
Land
2970 m2
-Prés
Land
2754 m2
-Futaies résineuses
Land
1591 m2
-Terres
229 transactions listed in the municipality
Compare with neighboring municipalities
City
name
name
house
Price per m²
Price per m²
apt.
Price per m²
Price per m²
City information
Zip code
- 25160 VAUX ET CHANTEGRUE
Data source & update
- Latest publication of the property value request (DVF) database made available by the DGFiP on October 19, 2025, covering transactions up to 06/30/2025:
- Administrative/cadastral division as of September 1, 2025, and municipal movements as of January 1, 2025: