emooki
HomePrice mapTransactions
🇬🇧 English🇫🇷 Français🇩🇪 Deutsch🇪🇸 Español🇮🇹 Italiano

Real estate price map


Real estate price map in the municipality of Pouilley-les-Vignes, choose a section to see transactions by parcel.

Doubs (25)

Pouilley-les-Vignes - Real estate price m²

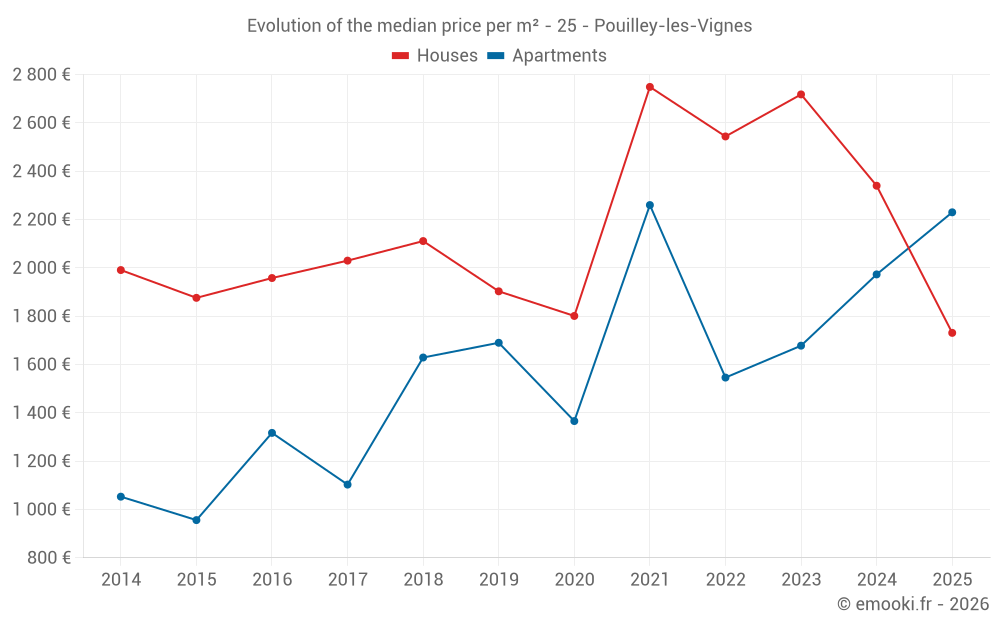
Median price of real estate
in the municipality of Pouilley-les-Vignes

HousesHouses
2 168  /m²
1-23-45-67-89-10
Reliability 7/10
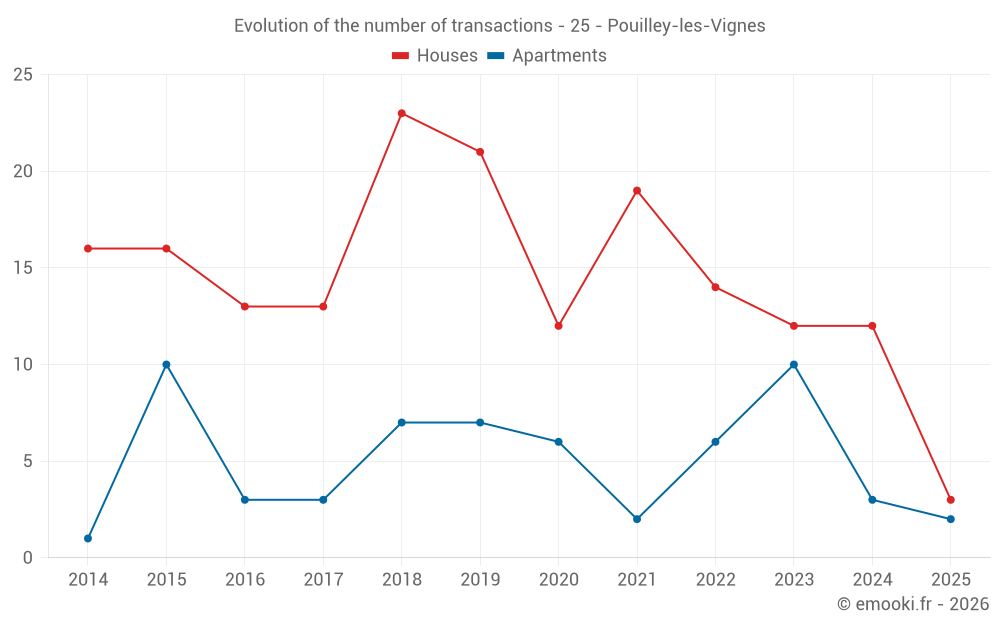
Median price on the 20 transactions of the last 24 months.
from 1 813 to
2 868  /m²
60% of transactions from the 2nd to the 8th deciles.
ApartmentsApartments
1 951  /m²
1-23-45-67-89-10
Reliability 6/10
Median price on the 17 transactions of the last 36 months.
from 1 551 to
3 158  /m²
60% of transactions from the 2nd to the 8th deciles.
DwellingsDwellings
1 992  /m²
1-23-45-67-89-10
Reliability 8/10
Median price on the 16 transactions of the last 12 months.
from 1 903 to
2 508  /m²
60% of transactions from the 2nd to the 8th deciles.

Yearly evolution

Evolution of the median price per m²

Evolution of the median price per m² - 25 - Pouilley-les-Vignes

Evolution of the number of transactions

Warning, last year incomplete. Projections made based on the proportions between semesters of the previous year at the departmental/national level and by type of property.

Evolution of the number of transactions - 25 - Pouilley-les-Vignes

Yearly data

Descending order
Year
Houses
house
transactions
Houses
house
Price per m²
Apartments
apt.
transactions
Apartments
apt.
Price per m²
2025
3
1 731 
2
2 230 
2024
12
2 340 
3
1 973 
2023
12
2 718 
10
1 678 
2022
14
2 544 
6
1 546 
2021
19
2 749 
2
2 260 
2020
12
1 801 
6
1 366 
2019
21
1 903 
7
1 690 
2018
23
2 111 
7
1 629 
2017
13
2 030 
3
1 103 
2016
13
1 958 
3
1 317 
2015
16
1 876 
10
956 
2014
16
1 991 
1
1 053 

Analysis

Structure of prices per m²

Values of price percentiles per m² over the periods used for the estimated price of each type of property.

Structure of transaction amounts

Values of transaction amounts percentiles over the periods used for the estimated price of each type of property.

Transaction amounts and prices per m² by percentile

Ascending order
Percentile
Houses
house
Price per m²
Houses
house
Transaction amount
Apartments
apt.
Price per m²
Apartments
apt.
Transaction amount
10th percentile
1 570 
152 K
1 450 
91 200 
20th percentile
1 813 
187 K
1 551 
92 200 
30th percentile
1 948 
204 K
1 552 
94 088 
40th percentile
2 067 
220 K
1 845 
110 K
50th percentile
2 168 
241 K
1 951 
126 K
60th percentile
2 339 
254 K
2 294 
140 K
70th percentile
2 513 
270 K
2 986 
176 K
80th percentile
2 868 
287 K
3 158 
180 K
90th percentile
3 290 
316 K
3 230 
196 K

National and departmental comparison

Evolution of the median price per m² of houses

Evolution of the median price per m² of apartments

Quarterly evolution

Evolution of the median price per m²

Evolution of the number of transactions

Quarterly data

Descending order
Quarter
Houses
house
transactions
Houses
house
Price per m²
Apartments
apt.
transactions
Apartments
apt.
Price per m²
2025 Q2
2
1 457 
1
1 951 
2025 Q1
1
1 731 
1
2 508 
2024 Q4
3
2 142 
1
1 973 
2024 Q3
5
2 348 
2
2 578 
2024 Q2
3
2 834 
0
--- 
2024 Q1
1
1 593 
0
--- 
2023 Q4
0
--- 
2
3 140 
2023 Q3
5
2 194 
0
--- 
2023 Q2
3
2 951 
5
1 551 
2023 Q1
4
2 718 
3
1 450 
2022 Q4
3
2 081 
2
2 362 
2022 Q3
2
2 909 
0
--- 
2022 Q2
7
2 481 
2
2 310 
2022 Q1
2
1 576 
2
1 158 
2021 Q4
2
2 836 
1
2 602 
2021 Q3
10
2 554 
1
1 919 
2021 Q2
5
2 973 
0
--- 
2021 Q1
2
2 627 
0
--- 
2020 Q4
3
1 731 
4
1 478 
2020 Q3
5
1 870 
1
1 352 
2020 Q2
1
2 248 
1
619 
2020 Q1
3
1 704 
0
--- 
2019 Q4
9
2 063 
4
1 792 
2019 Q3
3
1 660 
0
--- 
2019 Q2
5
1 895 
0
--- 
2019 Q1
4
2 155 
3
1 480 
2018 Q4
7
2 292 
0
--- 
2018 Q3
9
2 068 
4
1 452 
2018 Q2
5
1 698 
1
1 897 
2018 Q1
2
1 449 
2
1 651 
2017 Q4
4
2 244 
2
988 
2017 Q3
5
1 908 
0
--- 
2017 Q2
2
1 780 
1
1 393 
2017 Q1
2
1 896 
0
--- 
2016 Q4
6
2 206 
0
--- 
2016 Q3
2
1 946 
0
--- 
2016 Q2
3
1 941 
2
1 558 
2016 Q1
2
2 390 
1
939 
2015 Q4
5
1 470 
2
760 
2015 Q3
5
1 968 
1
701 
2015 Q2
4
1 951 
2
1 193 
2015 Q1
2
1 834 
5
926 
2014 Q4
2
2 688 
0
--- 
2014 Q3
8
2 118 
1
1 053 
2014 Q2
1
1 697 
0
--- 
2014 Q1
5
1 125 
0
--- 

Overview of the latest real estate transactions

The following list is an anonymized overview of the latest transactions. For more details and to find all transactions, please use the map to view transactions by plot or the transaction search page for a search by criteria.

2025-06-10
80 000 
1 951  /m²(41 m²)
Sale
Apartments
Apartment
1 room
41 m2
2 outbuildings
2025-05-26
155 000 
1 914  /m²(81 m²)
Sale
Houses
House
4 rooms
81 m2
Land
500 m2
-Sols
Land
943 m2
-Prés
Land
30 m2
-Prés
Land
28 m2
-Prés
2025-04-29
75 000 
1 000  /m²(75 m²)
Sale
Houses
House
2 rooms
75 m2
Land
827 m2
-Sols
2025-03-27
122 500 
Sale
Land
1038 m2
-Terrains à bâtir
2025-02-28
180 600 
2 508  /m²(72 m²)
Sale
Apartments
Apartment
3 rooms
72 m2
2 outbuildings
2025-02-14
450 
Sale
Land
244 m2
-Sols
Land
1551 m2
-Landes
/Friche
Land
177 m2
-Landes
/Friche
Land
307 m2
-Landes
/Friche
2025-01-16
315 000 
1 731  /m²(182 m²)
Sale
Houses
House
8 rooms
182 m2
Land
711 m2
-Sols
2024-12-24
125 000 
767  /m²(163 m²)
Sale
1 outbuilding
Apartments
Apartment
3 rooms
63 m2
1 outbuilding
Houses
House
4 rooms
100 m2
1 outbuilding
Land
1268 m2
-Sols
Land
18 m2
-Sols
2024-12-20
250 000 
Sale
Land
584 m2
-Terrains à bâtir
Land
649 m2
-Terrains à bâtir
Land
210 m2
-Sols
2024-12-04
205 000 
1 331  /m²(154 m²)
2 500  /m²(82 m²)
Sale
Houses
House
3 rooms
82 m2
Commercial property
72 m2
1 outbuilding
Land
409 m2
-Sols
Land
10 m2
-Sols
Land
40 m2
-Sols
2024-11-19
250 
Sale
Land
620 m2
-Vergers
Land
1200 m2
-Prés
Land
260 m2
-Prés
Land
810 m2
-Vergers
2024-11-15
82 800 
Sale
Land
512 m2
-Prés
2024-11-04
205 000 
2 010  /m²(102 m²)
Sale
Houses
House
5 rooms
102 m2
2024-10-30
328 000 
3 905  /m²(84 m²)
Sale
Houses
House
3 rooms
84 m2
1 outbuilding
Land
356 m2
-Sols
Land
291 m2
-Prés
Land
23 m2
-Sols
2024-10-25
282 800 
2 142  /m²(132 m²)
Sale
Houses
House
7 rooms
132 m2
Land
727 m2
-Sols
2024-10-21
3 000 
Sale
Land
1565 m2
-Vergers
Land
410 m2
-Vergers
Land
1880 m2
-Vergers
Land
810 m2
-Vergers
2024-10-17
275 000 
Sale
Land
362 m2
-Prés
Land
365 m2
-Prés
2024-10-14
148 000 
1 973  /m²(75 m²)
Sale
Apartments
Apartment
2 rooms
75 m2
3 outbuildings
2024-09-16
11 000 
Sale
Land
2755 m2
-Prés
2024-09-03
94 360 
3 254  /m²(29 m²)
Sale
Apartments
Apartment
1 room
29 m2
497 transactions listed in the municipality

Doubs (25)

Most expensive cities

City
name
Descending orderHouses
house
Price per m²
4 618 
4 041 
3 939 
3 768 
3 664 
3 529 
3 455 
City
name
Descending orderApartments
apt.
Price per m²
9 000 
3 578 
3 531 
3 523 
3 317 
3 250 
3 209 
3 192 

Least expensive cities

City
name
Ascending orderHouses
house
Price per m²
322 
356 
419 
464 
535 
602 
608 
City
name
Ascending orderApartments
apt.
Price per m²
86 
119 
134 
179 
184 
184 
228