Real estate price map
Real estate price map in the municipality of Nancray, choose a section to see transactions by parcel.
Doubs (25)
Price per m² in Nancray
Median price of real estate
in the municipality of Nancray
Houses
2 190 € /m²
Reliability 6/10
Median price on the 18 transactions of the last 36 months.
from 1 326 to
2 638 € /m²
2 638 € /m²
60% of transactions from the 2nd to the 8th deciles.
Apartments
1 598 € /m²
Reliability 6/10
Median price on the 14 transactions of the last 36 months.
from 1 273 to
2 127 € /m²
2 127 € /m²
60% of transactions from the 2nd to the 8th deciles.
Dwellings
2 134 € /m²
Reliability 7/10
Median price on the 21 transactions of the last 24 months.
from 1 342 to
2 609 € /m²
2 609 € /m²
60% of transactions from the 2nd to the 8th deciles.
Evolution of the price per m² of apartments since...
1 year
--
2 years
+31%
3 years
+26%
4 years
+121%
5 years
+23%
6 years
+127%
7 years
--
8 years
--
9 years
+118%
10 years
--
11 years
+140%
Yearly evolution
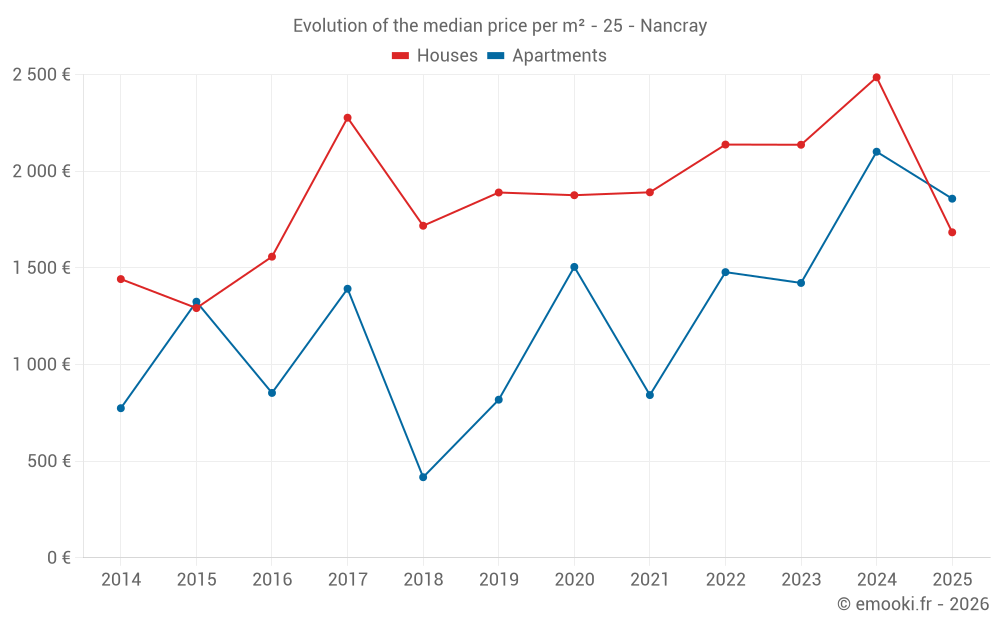
Evolution of the median price per m²
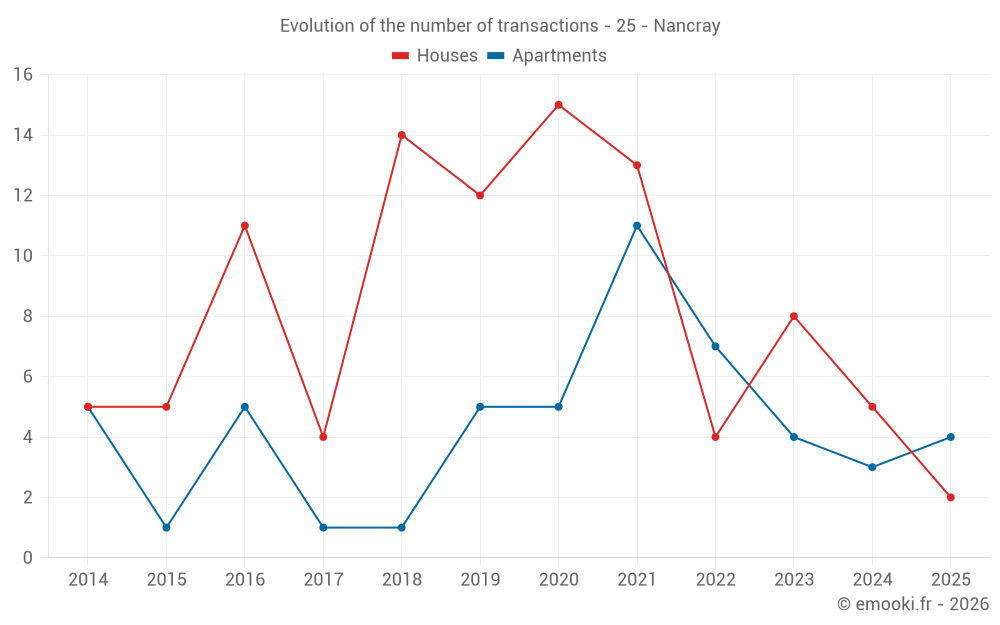
Evolution of the number of transactions
Warning, last year incomplete. Projections made based on the proportions between semesters of the previous year at the departmental/national level and by type of property.
Yearly data
Year
house
transactions
transactions
house
Price per m²
Price per m²
apt.
transactions
transactions
apt.
Price per m²
Price per m²
2025
2
1 684 €
4
1 858 €
2024
5
2 486 €
3
2 101 €
2023
8
2 137 €
4
1 422 €
2022
4
2 138 €
7
1 478 €
2021
13
1 891 €
11
842 €
2020
15
1 876 €
5
1 505 €
2019
12
1 890 €
5
818 €
2018
14
1 718 €
1
417 €
2017
4
2 277 €
1
1 392 €
2016
11
1 558 €
5
853 €
2015
5
1 292 €
1
1 325 €
2014
5
1 442 €
5
774 €
Analysis
Structure of prices per m²
Values of price percentiles per m² over the periods used for the estimated price of each type of property.
Structure of transaction amounts
Values of transaction amounts percentiles over the periods used for the estimated price of each type of property.
Transaction amounts and prices per m² by percentile
Percentile
house
Price per m²
Price per m²
house
Transaction amount
Transaction amount
apt.
Price per m²
Price per m²
apt.
Transaction amount
Transaction amount
10th percentile
1 098 €
134 K€
1 015 €
76 100 €
20th percentile
1 326 €
166 K€
1 273 €
103 K€
30th percentile
1 585 €
213 K€
1 341 €
104 K€
40th percentile
2 119 €
245 K€
1 514 €
125 K€
50th percentile
2 190 €
277 K€
1 598 €
146 K€
60th percentile
2 312 €
296 K€
1 887 €
151 K€
70th percentile
2 523 €
310 K€
2 103 €
171 K€
80th percentile
2 638 €
318 K€
2 127 €
178 K€
90th percentile
3 215 €
351 K€
2 300 €
187 K€
National and departmental comparison
Evolution of the median price per m² of houses
Evolution of the median price per m² of apartments
Quarterly evolution
Evolution of the median price per m²
Evolution of the number of transactions
Quarterly data
Quarter
house
transactions
transactions
house
Price per m²
Price per m²
apt.
transactions
transactions
apt.
Price per m²
Price per m²
2025 Q2
0
--- €
1
944 €
2025 Q1
2
1 684 €
3
2 373 €
2024 Q4
1
2 486 €
1
2 101 €
2024 Q3
3
2 686 €
1
2 129 €
2024 Q2
1
2 240 €
0
--- €
2024 Q1
0
--- €
1
1 534 €
2023 Q4
1
2 527 €
1
714 €
2023 Q3
4
2 668 €
1
1 663 €
2023 Q2
2
1 761 €
2
1 422 €
2023 Q1
1
1 288 €
0
--- €
2022 Q4
1
1 095 €
2
2 034 €
2022 Q3
2
2 312 €
1
1 182 €
2022 Q2
0
--- €
2
1 537 €
2022 Q1
1
2 219 €
2
1 252 €
2021 Q4
3
1 692 €
7
900 €
2021 Q3
4
1 556 €
0
--- €
2021 Q2
3
2 017 €
2
1 316 €
2021 Q1
3
2 095 €
2
758 €
2020 Q4
5
2 179 €
3
1 505 €
2020 Q3
7
2 013 €
1
1 602 €
2020 Q2
2
1 702 €
1
858 €
2020 Q1
1
1 533 €
0
--- €
2019 Q4
2
2 190 €
2
1 040 €
2019 Q3
4
1 676 €
0
--- €
2019 Q2
5
1 938 €
0
--- €
2019 Q1
1
260 €
3
818 €
2018 Q4
4
1 851 €
0
--- €
2018 Q3
4
1 848 €
0
--- €
2018 Q2
4
630 €
1
417 €
2018 Q1
2
1 464 €
0
--- €
2017 Q4
1
1 708 €
1
1 392 €
2017 Q3
1
4 000 €
0
--- €
2017 Q2
1
735 €
0
--- €
2017 Q1
1
2 846 €
0
--- €
2016 Q4
2
1 456 €
0
--- €
2016 Q3
5
1 582 €
2
632 €
2016 Q2
2
1 502 €
3
941 €
2016 Q1
2
1 686 €
0
--- €
2015 Q4
1
1 286 €
1
1 325 €
2015 Q3
3
1 550 €
0
--- €
2015 Q1
1
1 292 €
0
--- €
2014 Q4
2
1 454 €
0
--- €
2014 Q3
1
750 €
1
1 282 €
2014 Q2
0
--- €
2
700 €
2014 Q1
2
1 522 €
2
643 €
Overview of the latest real estate transactions
The following list is an anonymized overview of the latest transactions. For more details and to find all transactions, please use the map to view transactions by plot or the transaction search page for a search by criteria.
2025-06-27
350 €Sale
Land
5 m2
-Terrains d'agrément
2025-06-27
151 000 €944 € /m²(160 m²)
Sale
Apartment
5 rooms
160 m2
5 outbuildings
2025-01-30
180 000 €2 609 € /m²(69 m²)
Sale
Apartment
2 rooms
69 m2
2 outbuildings
2025-01-28
189 870 €2 373 € /m²(80 m²)
Sale
Apartment
3 rooms
80 m2
2 outbuildings
2025-01-17
102 000 €1 342 € /m²(76 m²)
Sale
Apartment
2 rooms
76 m2
1 outbuilding
2025-01-14
247 170 €2 268 € /m²(109 m²)
Sale
House
5 rooms
109 m2
Land
667 m2
-Prés
Land
240 m2
-Sols
Land
299 m2
-Landes
/Friche
2025-01-09
110 000 €1 100 € /m²(100 m²)
Sale
House
3 rooms
100 m2
Land
785 m2
-Sols
2024-12-02
9 900 €Sale
Land
6740 m2
-Terres
Land
6560 m2
-Terres
Land
14820 m2
-Terres
2024-11-06
276 000 €2 486 € /m²(111 m²)
Sale
House
4 rooms
111 m2
Land
500 m2
-Sols
Land
754 m2
-Prés
2024-10-28
214 345 €2 101 € /m²(102 m²)
Sale
Apartment
4 rooms
102 m2
2 outbuildings
2024-10-09
22 216 €Sale
Land
62820 m2
-Terres
Land
960 m2
-Taillis simples
Land
1800 m2
-Landes
/Friche
Land
1140 m2
-Prés
Land
600 m2
-Futaies résineuses
/EPICE
2024-08-28
317 000 €2 686 € /m²(118 m²)
Sale
House
4 rooms
118 m2
Land
898 m2
-Sols
2024-08-01
278 840 €3 242 € /m²(86 m²)
Sale
House
4 rooms
86 m2
Land
1061 m2
-Sols
2024-07-18
12 600 €108 € /m²(117 m²)
Sale
House
4 rooms
117 m2
Land
1028 m2
-Sols
Land
1532 m2
-Prés
Land
410 m2
-Prés
2024-07-10
149 000 €2 129 € /m²(70 m²)
Sale
Apartment
2 rooms
70 m2
2 outbuildings
2024-06-27
38 000 €844 € /m²(45 m²)
Sale
Commercial property
45 m2
1 outbuilding
2024-06-14
1 200 €Sale
Land
2085 m2
-Futaies résineuses
/EPICE
2024-06-14
1 237 €Sale
Land
1975 m2
-Futaies résineuses
/EPICE
Land
5370 m2
-Futaies résineuses
/EPICE
Land
2085 m2
-Futaies résineuses
/EPICE
Land
600 m2
-Landes
/Friche
Land
2862 m2
-Futaies résineuses
/EPICE
2024-06-05
100 050 €Sale
Land
869 m2
-Terrains à bâtir
2024-05-06
304 898 €248 € /m²(1229 m²)
Sale
Commercial property
Commercial property
806 m2
Land
2810 m2
-Sols
Land
7183 m2
-Sols
Land
8570 m2
-Sols
Land
530 m2
-Sols
Land
259 m2
-Sols
Land
160 m2
-Terres
Commercial property
141 m2
Commercial property
141 m2
Commercial property
141 m2
Land
27770 m2
-Prés
Land
4692 m2
-Taillis simples
Land
78669 m2
-Sols
Land
1208 m2
-Taillis simples
Land
2566 m2
-Taillis simples
Land
26668 m2
-Prés
249 transactions listed in the municipality
Compare with neighboring municipalities
City
name
name
house
Price per m²
Price per m²
apt.
Price per m²
Price per m²
City information
Zip code
- 25360 NANCRAY
Data source & update
- Latest publication of the property value request (DVF) database made available by the DGFiP on October 19, 2025, covering transactions up to 06/30/2025:
- Administrative/cadastral division as of September 1, 2025, and municipal movements as of January 1, 2025: