Real estate price map
Real estate price map in the municipality of Meslières, choose a section to see transactions by parcel.
Doubs (25)
Price per m² in Meslières
Median price of real estate
in the municipality of Meslières
Houses
1 496 € /m²
Reliability 6/10
Median price on the 12 transactions of the last 36 months.
from 860 to
1 910 € /m²
1 910 € /m²
60% of transactions from the 2nd to the 8th deciles.
Apartments
729 € /m²
Reliability 4/10
Median price on the 9 transactions of the last 60 months.
Dwellings
1 282 € /m²
Reliability 6/10
Median price on the 16 transactions of the last 36 months.
from 801 to
1 841 € /m²
1 841 € /m²
60% of transactions from the 2nd to the 8th deciles.
Yearly evolution
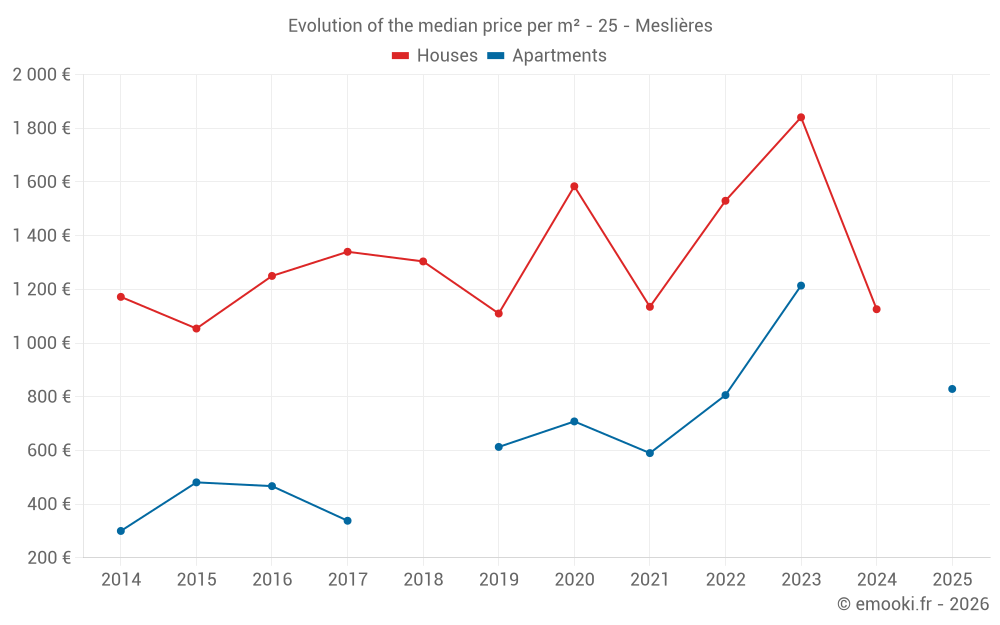
Evolution of the median price per m²
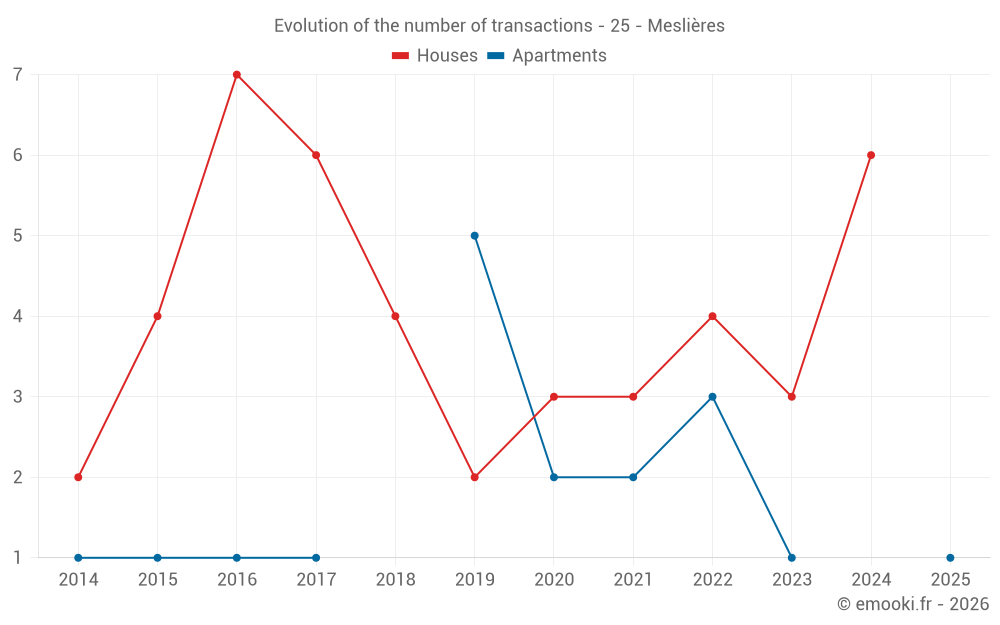
Evolution of the number of transactions
Warning, last year incomplete.
Yearly data
Year
house
transactions
transactions
house
Price per m²
Price per m²
apt.
transactions
transactions
apt.
Price per m²
Price per m²
2025
0
--- €
1
829 €
2024
6
1 126 €
0
--- €
2023
3
1 841 €
1
1 214 €
2022
4
1 530 €
3
806 €
2021
3
1 135 €
2
590 €
2020
3
1 584 €
2
708 €
2019
2
1 110 €
5
613 €
2018
4
1 304 €
0
--- €
2017
6
1 340 €
1
338 €
2016
7
1 250 €
1
467 €
2015
4
1 054 €
1
481 €
2014
2
1 172 €
1
300 €
Analysis
Structure of prices per m²
Values of price percentiles per m² over the periods used for the estimated price of each type of property.
Structure of transaction amounts
Values of transaction amounts percentiles over the periods used for the estimated price of each type of property.
Transaction amounts and prices per m² by percentile
Percentile
house
Price per m²
Price per m²
house
Transaction amount
Transaction amount
apt.
Price per m²
Price per m²
apt.
Transaction amount
Transaction amount
10th percentile
680 €
19 750 €
463 €
40 900 €
20th percentile
860 €
44 500 €
609 €
42 800 €
30th percentile
1 113 €
65 200 €
708 €
45 760 €
40th percentile
1 234 €
89 170 €
716 €
51 520 €
50th percentile
1 496 €
121 K€
729 €
58 000 €
60th percentile
1 683 €
131 K€
791 €
59 600 €
70th percentile
1 802 €
172 K€
820 €
60 600 €
80th percentile
1 910 €
207 K€
983 €
66 600 €
90th percentile
2 421 €
300 K€
1 322 €
95 828 €
National and departmental comparison
Evolution of the median price per m² of houses
Evolution of the median price per m² of apartments
Quarterly evolution
Evolution of the median price per m²
Evolution of the number of transactions
Quarterly data
Quarter
house
transactions
transactions
house
Price per m²
Price per m²
apt.
transactions
transactions
apt.
Price per m²
Price per m²
2025 Q1
0
--- €
1
829 €
2024 Q4
2
676 €
0
--- €
2024 Q3
2
1 154 €
0
--- €
2024 Q2
2
1 850 €
0
--- €
2023 Q4
1
1 927 €
0
--- €
2023 Q3
0
--- €
1
1 214 €
2023 Q2
2
1 321 €
0
--- €
2022 Q4
2
1 912 €
0
--- €
2022 Q3
1
1 711 €
2
1 111 €
2022 Q1
1
765 €
1
806 €
2021 Q4
1
357 €
0
--- €
2021 Q3
2
1 744 €
0
--- €
2021 Q2
0
--- €
1
729 €
2021 Q1
0
--- €
1
451 €
2020 Q4
2
2 587 €
0
--- €
2020 Q3
0
--- €
2
708 €
2020 Q2
1
1 584 €
0
--- €
2019 Q4
1
1 053 €
1
230 €
2019 Q3
0
--- €
1
685 €
2019 Q2
0
--- €
1
240 €
2019 Q1
1
1 168 €
2
627 €
2018 Q4
2
1 038 €
0
--- €
2018 Q3
1
931 €
0
--- €
2018 Q2
1
1 768 €
0
--- €
2017 Q4
4
1 340 €
1
338 €
2017 Q2
1
1 652 €
0
--- €
2017 Q1
1
1 159 €
0
--- €
2016 Q4
1
1 712 €
1
467 €
2016 Q3
4
1 458 €
0
--- €
2016 Q2
1
584 €
0
--- €
2016 Q1
1
877 €
0
--- €
2015 Q4
1
1 010 €
0
--- €
2015 Q3
2
1 786 €
0
--- €
2015 Q1
1
980 €
1
481 €
2014 Q3
1
1 775 €
1
300 €
2014 Q1
1
568 €
0
--- €
Overview of the latest real estate transactions
The following list is an anonymized overview of the latest transactions. For more details and to find all transactions, please use the map to view transactions by plot or the transaction search page for a search by criteria.
2025-03-27
58 000 €829 € /m²(70 m²)
Sale
Apartment
3 rooms
70 m2
1 outbuilding
2025-01-17
1 500 €Sale
Land
4895 m2
-Prés
2024-12-11
17 500 €1 094 € /m²(16 m²)
Sale
House
1 room
16 m2
Land
24 m2
-Sols
Land
2915 m2
-Prés
Land
1460 m2
-Taillis simples
2024-11-22
800 €Sale
1 outbuilding
Land
270 m2
-Terres
Land
327 m2
-Terres
Land
240 m2
-Terres
2024-10-23
105 €Sale
Land
300 m2
-Prés
2024-10-23
17 000 €258 € /m²(66 m²)
Sale
House
2 rooms
66 m2
Land
110 m2
-Sols
1 outbuilding
Land
26 m2
-Sols
2024-08-29
114 600 €Sale
1 outbuilding
Land
14 m2
-Sols
Land
5380 m2
-Prés
Land
9 m2
-Sols
Land
4 m2
-Sols
Land
500 m2
-Sols
Land
2427 m2
-Prés
Land
203 m2
-Sols
Land
4620 m2
-Prés
Land
615 m2
-Vergers
Land
5485 m2
-Prés
Land
615 m2
-Taillis simples
Land
7420 m2
-Terres
Land
9 m2
-Sols
Land
336 m2
-Sols
2024-07-26
133 000 €1 642 € /m²(81 m²)
Sale
House
5 rooms
81 m2
Land
2407 m2
-Prés
Land
348 m2
-Sols
Land
2 m2
-Vergers
Land
56 m2
-Vergers
Land
40 m2
-Vergers
Land
80 m2
-Vergers
2024-07-12
40 000 €667 € /m²(60 m²)
Sale
House
3 rooms
60 m2
Land
53 m2
-Sols
Land
490 m2
-Sols
Land
185 m2
-Sols
2024-05-21
318 000 €2 544 € /m²(125 m²)
Sale
House
4 rooms
125 m2
2 outbuildings
Land
1016 m2
-Sols
Land
2160 m2
-Prés
Land
1390 m2
-Vergers
2024-04-25
115 675 €1 157 € /m²(100 m²)
Sale
House
5 rooms
100 m2
Land
388 m2
-Sols
Land
490 m2
-Terres
Land
1230 m2
-Jardins
2024-04-18
35 000 €Sale
Land
164 m2
-Sols
Land
459 m2
-Sols
2024-02-07
950 €Sale
Land
840 m2
-Terres
2023-12-15
3 032 €Sale
Land
1900 m2
-Taillis simples
Land
3470 m2
-Taillis simples
Land
2520 m2
-Taillis simples
Land
1480 m2
-Terres
Land
14 m2
-Terres
Land
1775 m2
-Terres
Land
80 m2
-Prés
Land
2490 m2
-Prés
Land
880 m2
-Taillis simples
Land
650 m2
-Taillis simples
2023-11-07
212 000 €1 927 € /m²(110 m²)
Sale
House
3 rooms
110 m2
Land
1019 m2
-Sols
1 outbuilding
Land
18 m2
-Sols
Land
203 m2
-Sols
2023-09-27
500 €Sale
Land
1664 m2
-Vergers
2023-08-14
42 500 €1 214 € /m²(35 m²)
Sale
Apartment
2 rooms
35 m2
2023-06-30
127 000 €1 841 € /m²(69 m²)
Sale
House
3 rooms
69 m2
1 outbuilding
Land
142 m2
-Sols
Land
770 m2
-Vergers
2023-06-27
62 500 €801 € /m²(78 m²)
Sale
House
3 rooms
78 m2
4 outbuildings
Land
490 m2
-Sols
Land
120 m2
-Vergers
2023-01-24
130 000 €1 204 € /m²(108 m²)
Sale
House
3 rooms
108 m2
3 outbuildings
Land
73 m2
-Sols
1 outbuilding
Land
55 m2
-Sols
Land
94 m2
-Sols
Land
1552 m2
-Vergers
Land
800 m2
-Jardins
89 transactions listed in the municipality
Compare with neighboring municipalities
City
name
name
house
Price per m²
Price per m²
apt.
Price per m²
Price per m²
City information
Zip code
- 25310 MESLIERES
Data source & update
- Latest publication of the property value request (DVF) database made available by the DGFiP on October 19, 2025, covering transactions up to 06/30/2025:
- Administrative/cadastral division as of September 1, 2025, and municipal movements as of January 1, 2025: