Real estate price map
Real estate price map in the municipality of Laval-le-Prieuré, choose a section to see transactions by parcel.
Doubs (25)
Price per m² in Laval-le-Prieuré
Median price of real estate
in the municipality of Laval-le-Prieuré
Houses
1 761 € /m²
Reliability 2/10
Median price on the 7 transactions of the last 96 months.
Yearly evolution
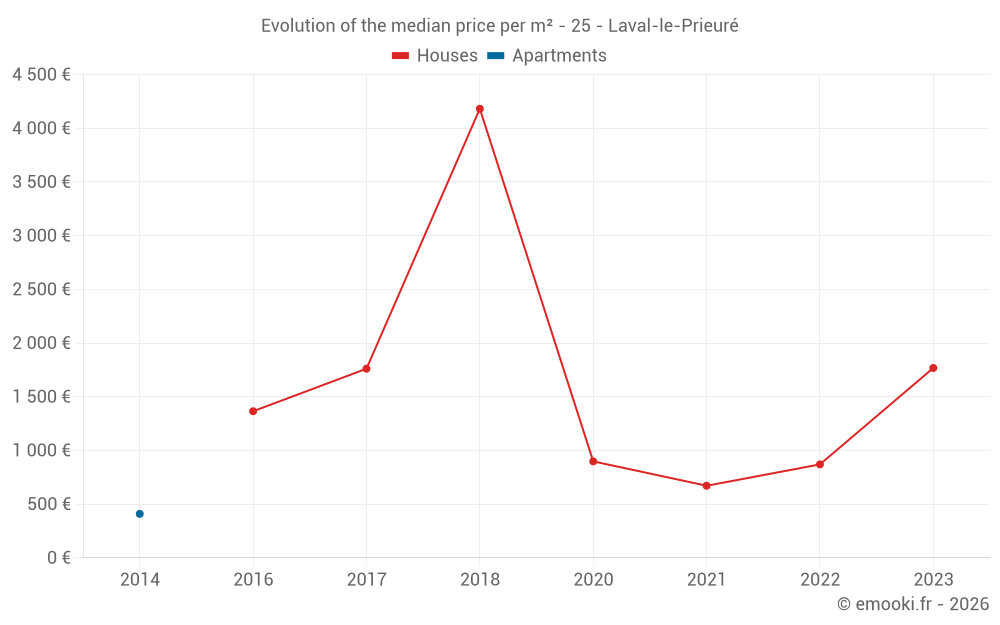
Evolution of the median price per m²
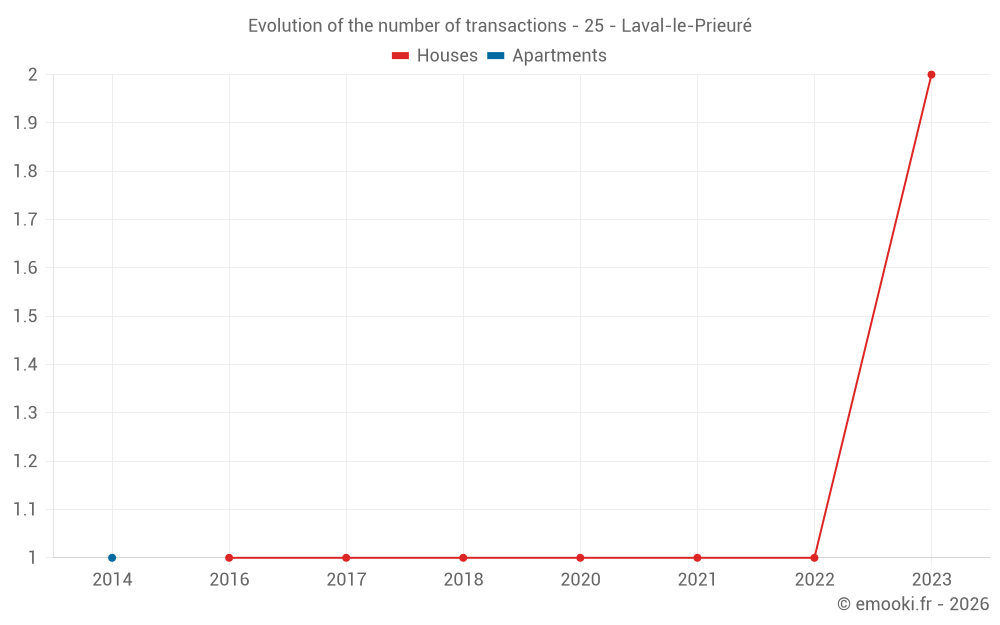
Evolution of the number of transactions
Warning, last year incomplete. Projections made based on the proportions between semesters of the previous year at the departmental/national level and by type of property.
Yearly data
Year
house
transactions
transactions
house
Price per m²
Price per m²
apt.
transactions
transactions
apt.
Price per m²
Price per m²
2025
0
--- €
0
--- €
2024
0
--- €
0
--- €
2023
2
1 768 €
0
--- €
2022
1
870 €
0
--- €
2021
1
671 €
0
--- €
2020
1
898 €
0
--- €
2019
0
--- €
0
--- €
2018
1
4 182 €
0
--- €
2017
1
1 761 €
0
--- €
2016
1
1 365 €
0
--- €
2015
0
--- €
0
--- €
2014
0
--- €
1
409 €
Analysis
Structure of prices per m²
Values of price percentiles per m² over the periods used for the estimated price of each type of property.
Structure of transaction amounts
Values of transaction amounts percentiles over the periods used for the estimated price of each type of property.
Transaction amounts and prices per m² by percentile
Percentile
house
Price per m²
Price per m²
house
Transaction amount
Transaction amount
apt.
Price per m²
Price per m²
apt.
Transaction amount
Transaction amount
10th percentile
790 €
113 K€
--- €
--- €
20th percentile
876 €
116 K€
--- €
--- €
30th percentile
892 €
119 K€
--- €
--- €
40th percentile
1 243 €
132 K€
--- €
--- €
50th percentile
1 761 €
150 K€
--- €
--- €
60th percentile
1 763 €
180 K€
--- €
--- €
70th percentile
1 766 €
206 K€
--- €
--- €
80th percentile
1 769 €
224 K€
--- €
--- €
90th percentile
2 735 €
235 K€
--- €
--- €
National and departmental comparison
Evolution of the median price per m² of houses
Evolution of the median price per m² of apartments
Quarterly evolution
Evolution of the median price per m²
Evolution of the number of transactions
Quarterly data
Quarter
house
transactions
transactions
house
Price per m²
Price per m²
apt.
transactions
transactions
apt.
Price per m²
Price per m²
2023 Q4
1
1 770 €
0
--- €
2023 Q1
1
1 765 €
0
--- €
2022 Q2
1
870 €
0
--- €
2021 Q3
1
671 €
0
--- €
2020 Q3
1
898 €
0
--- €
2018 Q3
1
4 182 €
0
--- €
2017 Q4
1
1 761 €
0
--- €
2016 Q4
1
1 365 €
0
--- €
2014 Q2
0
--- €
1
409 €
Overview of the latest real estate transactions
The following list is an anonymized overview of the latest transactions. For more details and to find all transactions, please use the map to view transactions by plot or the transaction search page for a search by criteria.
2024-12-19
5 500 €Sale
Land
5380 m2
-Prés
Land
800 m2
-Taillis sous futaie
Land
3860 m2
-Taillis sous futaie
2024-09-04
75 000 €Sale
Land
35230 m2
-Futaies résineuses
Land
53102 m2
-Futaies résineuses
Land
8810 m2
-Futaies résineuses
Land
1810 m2
-Futaies résineuses
2024-03-26
7 000 €Sale
Land
8540 m2
-Futaies résineuses
Land
36820 m2
-Futaies résineuses
2023-12-05
4 000 €Sale
Land
8415 m2
-Taillis sous futaie
Land
8585 m2
-Futaies résineuses
2023-11-30
1 616 €Exchange
Land
359 m2
-Landes
/Friche
2023-11-30
666 €Exchange
Land
148 m2
-Sols
2023-11-30
200 000 €1 770 € /m²(113 m²)
Sale
House
5 rooms
113 m2
1 outbuilding
Land
704 m2
-Sols
Land
359 m2
-Landes
/Friche
Land
414 m2
-Sols
Land
3300 m2
-Prés
Land
1702 m2
-Terres
Land
885 m2
-Taillis simples
2023-09-20
5 934 €Sale
Land
931 m2
-Prés
Land
58 m2
-Prés
2023-03-06
150 000 €1 765 € /m²(85 m²)
Sale
House
3 rooms
85 m2
Land
815 m2
-Sols
Land
420 m2
-Jardins
2023-02-03
1 125 €Sale
Land
250 m2
-Landes
/Friche
2023-02-01
65 000 €Sale
Land
7003 m2
-Taillis sous futaie
Land
7002 m2
-Futaies résineuses
Land
11110 m2
-Prés
Land
20555 m2
-Terres
Land
5410 m2
-Prés
Land
8690 m2
-Prés
Land
1500 m2
-Taillis sous futaie
Land
17460 m2
-Prés
2022-11-25
7 000 €Sale
Land
11280 m2
-Terres
Land
11910 m2
-Terres
2022-07-01
3 000 €Sale
Land
12970 m2
-Prés
2022-05-28
120 000 €870 € /m²(138 m²)
Sale
House
4 rooms
138 m2
Land
1600 m2
-Sols
Land
1800 m2
-Landes
/Friche
2022-03-07
15 000 €Sale
Land
1860 m2
-Taillis sous futaie
Land
1860 m2
-Futaies résineuses
Land
10555 m2
-Futaies résineuses
Land
10555 m2
-Taillis sous futaie
2021-07-05
110 000 €671 € /m²(164 m²)
Sale
House
5 rooms
164 m2
Land
1510 m2
-Sols
Land
2701 m2
-Vergers
Land
1351 m2
-Jardins
2021-05-27
20 000 €Sale
Land
14800 m2
-Futaies résineuses
2021-04-08
3 000 €Sale
Land
1073 m2
-Vergers
2020-11-10
420 €Sale
Land
140 m2
-Landes
/Friche
2020-07-08
115 000 €898 € /m²(128 m²)
Sale
House
5 rooms
128 m2
Land
945 m2
-Sols
41 transactions listed in the municipality
Compare with neighboring municipalities
City
name
name
house
Price per m²
Price per m²
apt.
Price per m²
Price per m²
City information
Zip code
- 25210 LAVAL LE PRIEURE
Data source & update
- Latest publication of the property value request (DVF) database made available by the DGFiP on October 19, 2025, covering transactions up to 06/30/2025:
- Administrative/cadastral division as of September 1, 2025, and municipal movements as of January 1, 2025: