Real estate price map
Real estate price map in the municipality of Fournets-Luisans, choose a section to see transactions by parcel.
Doubs (25)
Price per m² in Fournets-Luisans
Median price of real estate
in the municipality of Fournets-Luisans
Houses
2 361 € /m²
Reliability 6/10
Median price on the 13 transactions of the last 36 months.
from 1 559 to
3 404 € /m²
3 404 € /m²
60% of transactions from the 2nd to the 8th deciles.
Apartments
1 655 € /m²
Reliability 5/10
Median price on the 11 transactions of the last 48 months.
from 948 to
2 148 € /m²
2 148 € /m²
60% of transactions from the 2nd to the 8th deciles.
Dwellings
2 269 € /m²
Reliability 6/10
Median price on the 17 transactions of the last 36 months.
from 1 488 to
3 343 € /m²
3 343 € /m²
60% of transactions from the 2nd to the 8th deciles.
Yearly evolution
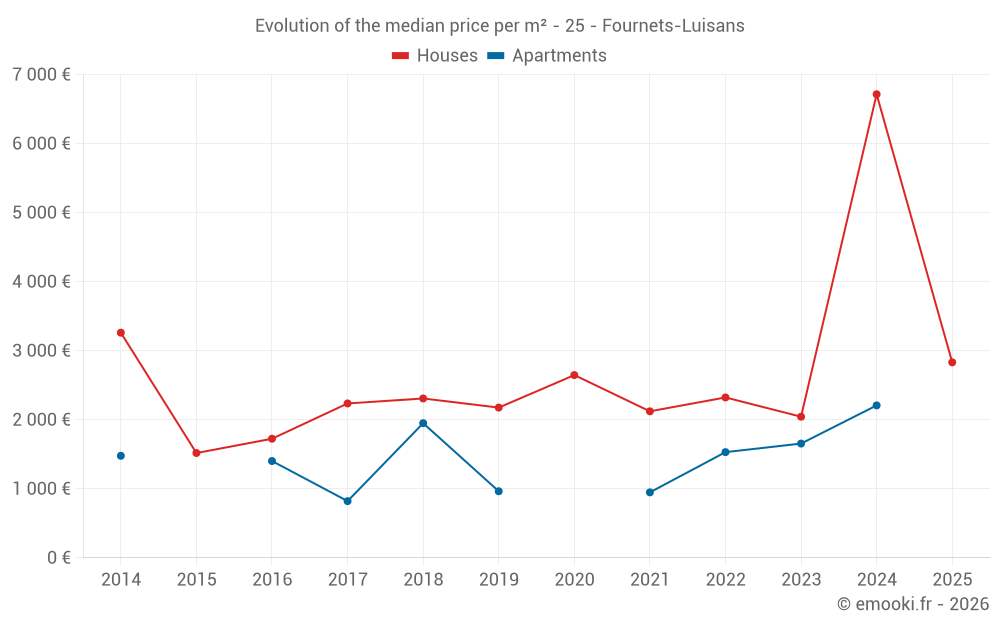
Evolution of the median price per m²
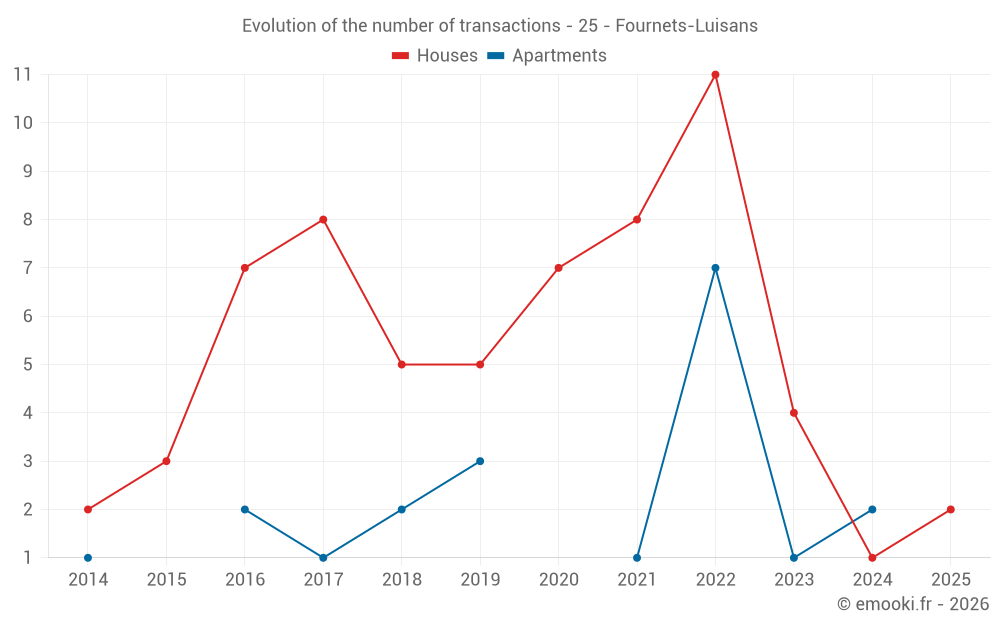
Evolution of the number of transactions
Warning, last year incomplete. Projections made based on the proportions between semesters of the previous year at the departmental/national level and by type of property.
Yearly data
Year
house
transactions
transactions
house
Price per m²
Price per m²
apt.
transactions
transactions
apt.
Price per m²
Price per m²
2025
2
2 832 €
0
--- €
2024
1
6 715 €
2
2 208 €
2023
4
2 044 €
1
1 655 €
2022
11
2 323 €
7
1 531 €
2021
8
2 122 €
1
948 €
2020
7
2 647 €
0
--- €
2019
5
2 176 €
3
964 €
2018
5
2 308 €
2
1 950 €
2017
8
2 236 €
1
821 €
2016
7
1 725 €
2
1 402 €
2015
3
1 518 €
0
--- €
2014
2
3 261 €
1
1 478 €
Analysis
Structure of prices per m²
Values of price percentiles per m² over the periods used for the estimated price of each type of property.
Structure of transaction amounts
Values of transaction amounts percentiles over the periods used for the estimated price of each type of property.
Transaction amounts and prices per m² by percentile
Percentile
house
Price per m²
Price per m²
house
Transaction amount
Transaction amount
apt.
Price per m²
Price per m²
apt.
Transaction amount
Transaction amount
10th percentile
990 €
120 K€
927 €
118 K€
20th percentile
1 559 €
151 K€
948 €
149 K€
30th percentile
1 951 €
235 K€
1 358 €
162 K€
40th percentile
2 274 €
274 K€
1 531 €
193 K€
50th percentile
2 361 €
303 K€
1 655 €
220 K€
60th percentile
3 191 €
326 K€
1 833 €
228 K€
70th percentile
3 338 €
353 K€
1 862 €
247 K€
80th percentile
3 404 €
416 K€
2 148 €
255 K€
90th percentile
4 667 €
453 K€
2 269 €
287 K€
National and departmental comparison
Evolution of the median price per m² of houses
Evolution of the median price per m² of apartments
Quarterly evolution
Evolution of the median price per m²
Evolution of the number of transactions
Quarterly data
Quarter
house
transactions
transactions
house
Price per m²
Price per m²
apt.
transactions
transactions
apt.
Price per m²
Price per m²
2025 Q2
1
3 346 €
0
--- €
2025 Q1
1
2 317 €
0
--- €
2024 Q4
0
--- €
1
2 148 €
2024 Q3
1
6 715 €
1
2 269 €
2023 Q4
1
876 €
0
--- €
2023 Q2
2
2 902 €
1
1 655 €
2023 Q1
1
1 728 €
0
--- €
2022 Q4
2
1 052 €
1
927 €
2022 Q3
4
3 244 €
0
--- €
2022 Q2
2
2 320 €
3
1 358 €
2022 Q1
3
2 708 €
3
1 833 €
2021 Q4
1
2 500 €
0
--- €
2021 Q3
2
2 292 €
1
948 €
2021 Q2
1
2 328 €
0
--- €
2021 Q1
4
1 890 €
0
--- €
2020 Q4
2
3 080 €
0
--- €
2020 Q3
2
2 588 €
0
--- €
2020 Q2
1
1 646 €
0
--- €
2020 Q1
2
1 809 €
0
--- €
2019 Q4
2
2 074 €
1
917 €
2019 Q3
1
3 468 €
1
1 501 €
2019 Q2
1
2 186 €
1
964 €
2019 Q1
1
1 449 €
0
--- €
2018 Q4
3
2 308 €
0
--- €
2018 Q3
1
738 €
2
1 950 €
2018 Q1
1
2 449 €
0
--- €
2017 Q4
3
2 135 €
0
--- €
2017 Q3
3
3 063 €
0
--- €
2017 Q2
1
833 €
0
--- €
2017 Q1
1
2 346 €
1
821 €
2016 Q4
0
--- €
1
1 121 €
2016 Q3
3
1 725 €
0
--- €
2016 Q2
4
1 876 €
1
1 683 €
2015 Q3
2
2 532 €
0
--- €
2015 Q1
1
814 €
0
--- €
2014 Q4
1
3 375 €
0
--- €
2014 Q1
1
3 147 €
1
1 478 €
Overview of the latest real estate transactions
The following list is an anonymized overview of the latest transactions. For more details and to find all transactions, please use the map to view transactions by plot or the transaction search page for a search by criteria.
2025-04-28
1 000 €Sale
Land
1070 m2
-Landes
/Friche
2025-04-22
8 500 €Sale
Land
490 m2
-Sols
2025-04-04
435 000 €3 346 € /m²(130 m²)
Sale
House
4 rooms
130 m2
Land
408 m2
-Sols
Land
4711 m2
-Prés
Land
720 m2
-Futaies résineuses
Land
1040 m2
-Futaies résineuses
Land
2752 m2
-Prés
2025-03-20
4 300 €Sale
Land
1308 m2
-Futaies résineuses
Land
1307 m2
-Futaies résineuses
2025-03-13
278 000 €2 317 € /m²(120 m²)
Sale
House
5 rooms
120 m2
Land
800 m2
-Sols
Land
900 m2
-Prés
2025-03-12
3 182 €Sale
Land
1530 m2
-Futaies résineuses
2025-01-31
4 700 €Sale
Land
1920 m2
-Futaies résineuses
2024-10-24
247 000 €2 148 € /m²(115 m²)
Sale
Apartment
3 rooms
115 m2
1 outbuilding
2024-10-10
56 970 €transaction.nature.Vente terrain à bâtir
Land
633 m2
-Prés
2024-10-10
70 000 €Sale
Land
999 m2
-Terres
2024-08-14
192 900 €2 269 € /m²(85 m²)
Sale
Apartment
4 rooms
85 m2
3 outbuildings
2024-07-08
61 650 €Sale
Land
33 m2
-Prés
Land
656 m2
-Prés
2024-07-08
523 800 €6 715 € /m²(78 m²)
Sale
House
4 rooms
78 m2
Land
600 m2
-Sols
Land
673 m2
-Prés
2024-05-28
376 €Sale
Land
94 m2
-Prés
2024-05-28
6 400 €Sale
Land
11740 m2
-Terres
Land
100 m2
-Landes
/Friche
2024-04-29
1 €Sale
Land
1473 m2
-Futaies résineuses
/EPICE
2024-04-29
1 €Sale
Land
60 m2
-Sols
Land
84 m2
-Landes
/Friche
2024-02-20
1 095 €Exchange
Land
3649 m2
-Prés
2024-02-20
461 €Exchange
Land
620 m2
-Prés
2023-12-29
3 497 €Sale
Land
269 m2
-Prés
191 transactions listed in the municipality
Compare with neighboring municipalities
City
name
name
house
Price per m²
Price per m²
apt.
Price per m²
Price per m²
City information
Zip codes
- 25390 FOURNETS LUISANS
- LUISANS 25390 FOURNETS LUISANS
Data source & update
- Latest publication of the property value request (DVF) database made available by the DGFiP on October 19, 2025, covering transactions up to 06/30/2025:
- Administrative/cadastral division as of September 1, 2025, and municipal movements as of January 1, 2025: