emooki
HomePrice mapTransactions
🇬🇧 English🇫🇷 Français🇩🇪 Deutsch🇪🇸 Español🇮🇹 Italiano

Real estate price map


Real estate price map in the municipality of Fesches-le-Châtel, choose a section to see transactions by parcel.

Doubs (25)
Fesches-le-Châtel

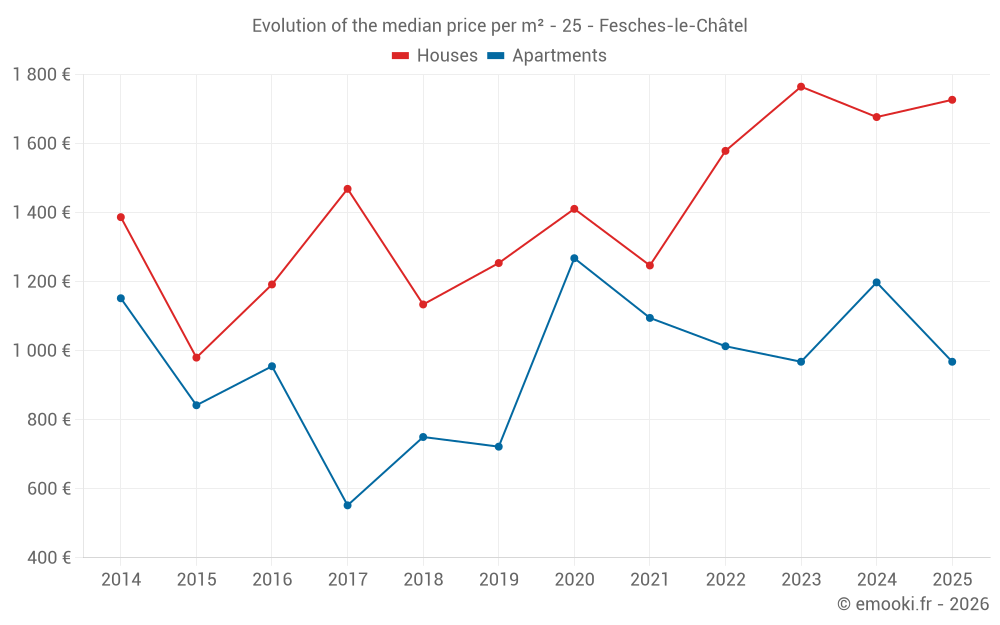
Median price of real estate
in the municipality of Fesches-le-Châtel

HousesHouses
1 716  /m²
1-23-45-67-89-10
Reliability 7/10
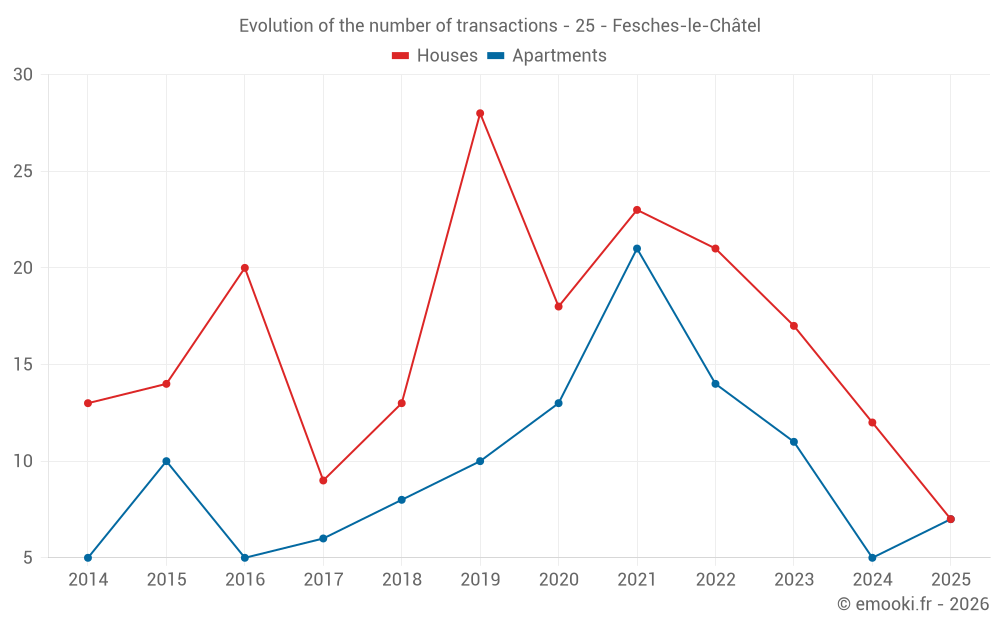
Median price on the 28 transactions of the last 24 months.
from 1 316 to
2 034  /m²
60% of transactions from the 2nd to the 8th deciles.
ApartmentsApartments
977  /m²
1-23-45-67-89-10
Reliability 7/10
Median price on the 16 transactions of the last 24 months.
from 649 to
1 269  /m²
60% of transactions from the 2nd to the 8th deciles.
DwellingsDwellings
1 224  /m²
1-23-45-67-89-10
Reliability 8/10
Median price on the 23 transactions of the last 12 months.
from 956 to
1 835  /m²
60% of transactions from the 2nd to the 8th deciles.
HousesEvolution of the price per m² of houses since...
1 year
+3%
2 years
-2.2%
3 years
+9.4%
4 years
+38%
5 years
+22%
6 years
+38%
7 years
+52%
8 years
+18%
9 years
+45%
10 years
+76%
11 years
+25%
The price per m² of houses has decreased by 2.2% since 2 years, but it has increased by 76% in 10 years.
ApartmentsEvolution of the price per m² of apartments since...
1 year
-19%
2 years
0%
3 years
-4.4%
4 years
-12%
5 years
-24%
6 years
+34%
7 years
+29%
8 years
+75%
9 years
+1.4%
10 years
+15%
11 years
-16%
The price per m² of apartments has decreased by 24% since 5 years, but it has increased by 75% in 8 years.

Yearly evolution

Evolution of the median price per m²

Evolution of the number of transactions

Warning, last year incomplete. Projections made based on the proportions between semesters of the previous year at the departmental/national level and by type of property.

Yearly data

Descending order
Year
Houses
house
transactions
Houses
house
Price per m²
Apartments
apt.
transactions
Apartments
apt.
Price per m²
2025
7
1 727 
7
968 
2024
12
1 677 
5
1 198 
2023
17
1 765 
11
968 
2022
21
1 579 
14
1 013 
2021
23
1 247 
21
1 095 
2020
18
1 411 
13
1 268 
2019
28
1 254 
10
722 
2018
13
1 134 
8
750 
2017
9
1 469 
6
552 
2016
20
1 192 
5
955 
2015
14
980 
10
842 
2014
13
1 387 
5
1 152 

Analysis

Structure of prices per m²

Values of price percentiles per m² over the periods used for the estimated price of each type of property.

Structure of transaction amounts

Values of transaction amounts percentiles over the periods used for the estimated price of each type of property.

Transaction amounts and prices per m² by percentile

Ascending order
Percentile
Houses
house
Price per m²
Houses
house
Transaction amount
Apartments
apt.
Price per m²
Apartments
apt.
Transaction amount
10th percentile
1 174 
97 540 
524 
54 000 
20th percentile
1 316 
115 K
649 
56 600 
30th percentile
1 603 
130 K
722 
58 000 
40th percentile
1 643 
139 K
898 
62 100 
50th percentile
1 716 
148 K
977 
71 400 
60th percentile
1 782 
152 K
1 047 
75 500 
70th percentile
1 978 
171 K
1 211 
80 711 
80th percentile
2 034 
208 K
1 269 
157 K
90th percentile
2 387 
239 K
1 716 
180 K

National and departmental comparison

Evolution of the median price per m² of houses

Evolution of the median price per m² of apartments

Quarterly evolution

Evolution of the median price per m²

Evolution of the number of transactions

Quarterly data

Descending order
Quarter
Houses
house
transactions
Houses
house
Price per m²
Apartments
apt.
transactions
Apartments
apt.
Price per m²
2025 Q2
2
1 480 
3
898 
2025 Q1
5
1 727 
4
977 
2024 Q4
4
1 492 
2
884 
2024 Q3
3
1 649 
0
--- 
2024 Q2
4
2 188 
1
688 
2024 Q1
1
1 727 
2
1 301 
2023 Q4
7
1 982 
3
756 
2023 Q3
2
1 461 
1
1 047 
2023 Q2
1
1 511 
4
1 069 
2023 Q1
7
1 765 
3
968 
2022 Q4
3
1 525 
4
1 126 
2022 Q3
8
2 124 
0
--- 
2022 Q2
4
1 332 
2
710 
2022 Q1
6
1 466 
8
980 
2021 Q4
6
1 208 
2
2 336 
2021 Q3
2
977 
11
1 063 
2021 Q2
9
1 289 
5
1 202 
2021 Q1
6
1 287 
3
947 
2020 Q4
5
1 164 
5
1 259 
2020 Q3
7
1 688 
2
1 805 
2020 Q2
2
1 721 
2
2 014 
2020 Q1
4
1 302 
4
1 320 
2019 Q4
7
1 006 
4
962 
2019 Q3
10
1 202 
2
1 077 
2019 Q2
6
1 428 
3
619 
2019 Q1
5
1 250 
1
1 329 
2018 Q4
3
1 192 
3
793 
2018 Q3
0
--- 
2
642 
2018 Q2
3
1 069 
2
1 182 
2018 Q1
7
1 350 
1
589 
2017 Q4
2
1 404 
1
1 025 
2017 Q3
2
1 881 
1
594 
2017 Q2
5
1 158 
2
576 
2017 Q1
0
--- 
2
474 
2016 Q4
6
1 182 
0
--- 
2016 Q3
5
1 272 
1
917 
2016 Q2
5
1 045 
1
1 515 
2016 Q1
4
1 486 
3
955 
2015 Q4
4
1 683 
5
1 087 
2015 Q3
3
867 
2
682 
2015 Q2
3
959 
2
753 
2015 Q1
4
1 006 
1
922 
2014 Q4
4
1 812 
1
1 152 
2014 Q3
5
1 198 
3
1 370 
2014 Q2
2
1 370 
0
--- 
2014 Q1
2
1 370 
1
811 

Overview of the latest real estate transactions

The following list is an anonymized overview of the latest transactions. For more details and to find all transactions, please use the map to view transactions by plot or the transaction search page for a search by criteria.

2025-06-27
67 300 
1 224  /m²(55 m²)
Sale
Apartments
Apartment
3 rooms
55 m2
1 outbuilding
2025-06-23
157 400 
477  /m²(330 m²)
Sale
Apartments
Apartment
2 rooms
55 m2
Apartments
Apartment
1 room
41 m2
Apartments
Apartment
2 rooms
59 m2
Apartments
Apartment
3 rooms
88 m2
Apartments
Apartment
2 rooms
51 m2
Apartments
Apartment
2 rooms
36 m2
11 outbuildings
Land
573 m2
-Sols
Land
517 m2
-Vergers
2025-04-29
140 000 
2 000  /m²(70 m²)
Sale
Houses
House
4 rooms
70 m2
Land
663 m2
-Sols
Land
117 m2
-Terres
2025-04-25
76 900 
961  /m²(80 m²)
Sale
Houses
House
5 rooms
80 m2
Land
227 m2
-Sols
2025-04-02
56 600 
898  /m²(63 m²)
Sale
Apartments
Apartment
3 rooms
63 m2
2025-03-25
100 000 
952  /m²(105 m²)
Sale
Houses
House
6 rooms
105 m2
Land
510 m2
-Sols
2025-03-18
77 000 
1 167  /m²(66 m²)
Sale
Houses
House
3 rooms
66 m2
Land
102 m2
-Sols
Land
411 m2
-Sols
2025-03-07
62 100 
986  /m²(63 m²)
Sale
1 outbuilding
Apartments
Apartment
3 rooms
63 m2
2025-02-27
238 950 
2 914  /m²(82 m²)
Sale
Apartments
Apartment
4 rooms
82 m2
3 outbuildings
2025-02-26
285 000 
1 727  /m²(165 m²)
Sale
Houses
House
5 rooms
165 m2
Land
930 m2
-Sols
2025-02-26
26 600 
649  /m²(41 m²)
Sale
Apartments
Apartment
2 rooms
41 m2
1 outbuilding
2025-02-17
149 160 
1 755  /m²(85 m²)
Sale
Houses
House
4 rooms
85 m2
Land
248 m2
-Sols
2025-02-14
152 000 
1 974  /m²(77 m²)
Sale
Houses
House
3 rooms
77 m2
Land
620 m2
-Sols
Land
25 m2
-Prés
Land
820 m2
-Terrains à bâtir
Land
138 m2
-Vergers
2025-01-30
75 500 
968  /m²(78 m²)
Sale
Apartments
Apartment
4 rooms
78 m2
1 outbuilding
2024-12-28
153 000 
1 889  /m²(81 m²)
Sale
Houses
House
4 rooms
81 m2
Land
561 m2
-Sols
2024-12-28
380 000 
900  /m²(422 m²)
1 333  /m²(285 m²)
Sale
Apartments
Apartment
3 rooms
65 m2
Apartments
Apartment
3 rooms
76 m2
Apartments
Apartment
3 rooms
76 m2
Apartments
Apartment
2 rooms
68 m2
Commercial property
101 m2
Commercial property
36 m2
2 outbuildings
Land
650 m2
-Sols
2024-12-16
75 500 
1 198  /m²(63 m²)
Sale
Apartments
Apartment
3 rooms
63 m2
1 outbuilding
2024-12-02
150 000 
1 705  /m²(88 m²)
Sale
Houses
House
4 rooms
88 m2
Land
631 m2
-Sols
2024-11-29
10 533 
Sale
Land
31918 m2
-Landes
2024-11-29
4 953 
Sale
Land
15010 m2
-Landes
433 transactions listed in the municipality

Doubs (25)

Most expensive cities

City
name
Descending orderHouses
house
Price per m²
4 618 
4 041 
3 939 
3 768 
3 664 
3 529 
3 455 
City
name
Descending orderApartments
apt.
Price per m²
9 000 
3 578 
3 531 
3 523 
3 317 
3 250 
3 209 
3 192 

Least expensive cities

City
name
Ascending orderHouses
house
Price per m²
322 
356 
419 
464 
535 
602 
608 
City
name
Ascending orderApartments
apt.
Price per m²
86 
119 
134 
179 
184 
184 
228