Real estate price map
Real estate price map in the municipality of Faimbe, choose a section to see transactions by parcel.
Doubs (25)
Price per m² in Faimbe
Median price of real estate
in the municipality of Faimbe
Houses
1 780 € /m²
Reliability 2/10
Median price on the 5 transactions of the last 96 months.
Apartments
942 € /m²
Reliability 3/10
Median price on the 7 transactions of the last 72 months.
Dwellings
1 000 € /m²
Reliability 4/10
Median price on the 9 transactions of the last 60 months.
Yearly evolution
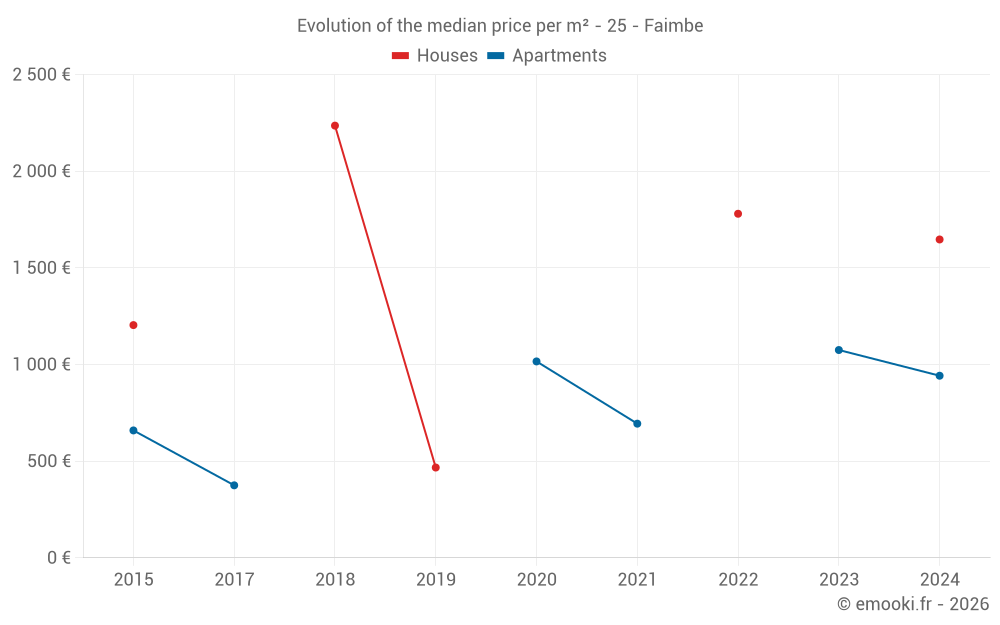
Evolution of the median price per m²
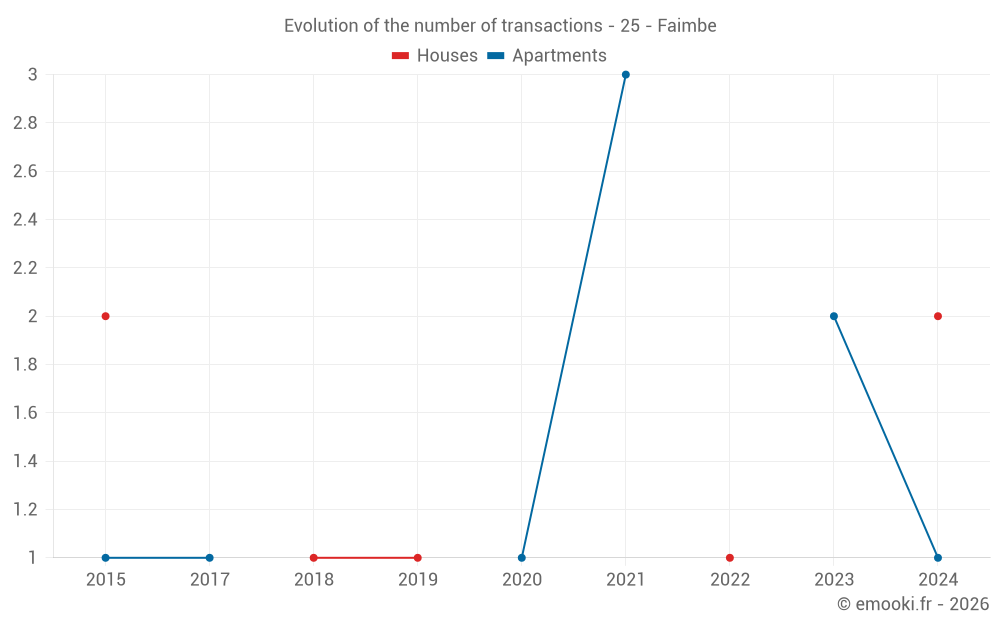
Evolution of the number of transactions
Warning, last year incomplete. Projections made based on the proportions between semesters of the previous year at the departmental/national level and by type of property.
Yearly data
Year
house
transactions
transactions
house
Price per m²
Price per m²
apt.
transactions
transactions
apt.
Price per m²
Price per m²
2025
0
--- €
0
--- €
2024
2
1 647 €
1
942 €
2023
0
--- €
2
1 075 €
2022
1
1 780 €
0
--- €
2021
0
--- €
3
694 €
2020
0
--- €
1
1 016 €
2019
1
467 €
0
--- €
2018
1
2 236 €
0
--- €
2017
0
--- €
1
375 €
2016
0
--- €
0
--- €
2015
2
1 204 €
1
659 €
2014
0
--- €
0
--- €
Analysis
Structure of prices per m²
Values of price percentiles per m² over the periods used for the estimated price of each type of property.
Structure of transaction amounts
Values of transaction amounts percentiles over the periods used for the estimated price of each type of property.
Transaction amounts and prices per m² by percentile
Percentile
house
Price per m²
Price per m²
house
Transaction amount
Transaction amount
apt.
Price per m²
Price per m²
apt.
Transaction amount
Transaction amount
10th percentile
875 €
63 000 €
673 €
30 340 €
20th percentile
1 284 €
91 000 €
699 €
37 120 €
30th percentile
1 546 €
113 K€
713 €
46 780 €
40th percentile
1 663 €
129 K€
808 €
56 000 €
50th percentile
1 780 €
145 K€
942 €
65 000 €
60th percentile
1 790 €
151 K€
977 €
65 210 €
70th percentile
1 801 €
158 K€
1 003 €
67 280 €
80th percentile
1 892 €
179 K€
1 013 €
73 070 €
90th percentile
2 064 €
216 K€
1 070 €
91 000 €
National and departmental comparison
Evolution of the median price per m² of houses
Evolution of the median price per m² of apartments
Quarterly evolution
Evolution of the median price per m²
Evolution of the number of transactions
Quarterly data
Quarter
house
transactions
transactions
house
Price per m²
Price per m²
apt.
transactions
transactions
apt.
Price per m²
Price per m²
2024 Q3
1
1 488 €
1
942 €
2024 Q1
1
1 806 €
0
--- €
2023 Q4
0
--- €
2
1 075 €
2022 Q4
1
1 780 €
0
--- €
2021 Q4
0
--- €
1
641 €
2021 Q3
0
--- €
1
694 €
2021 Q2
0
--- €
1
718 €
2020 Q1
0
--- €
1
1 016 €
2019 Q2
1
467 €
0
--- €
2018 Q3
1
2 236 €
0
--- €
2017 Q1
0
--- €
1
375 €
2015 Q4
0
--- €
1
659 €
2015 Q3
1
1 000 €
0
--- €
2015 Q2
1
1 407 €
0
--- €
Overview of the latest real estate transactions
The following list is an anonymized overview of the latest transactions. For more details and to find all transactions, please use the map to view transactions by plot or the transaction search page for a search by criteria.
2024-07-30
33 900 €942 € /m²(36 m²)
Sale
Apartment
1 room
36 m2
1 outbuilding
2024-07-10
253 000 €1 488 € /m²(170 m²)
Sale
House
5 rooms
170 m2
Land
1050 m2
-Sols
Land
475 m2
-Taillis simples
Land
2639 m2
-Prés
2024-03-22
144 500 €1 806 € /m²(80 m²)
Sale
House
4 rooms
80 m2
Land
342 m2
-Sols
Land
1530 m2
-Prés
2023-12-22
75 000 €1 000 € /m²(75 m²)
Sale
Apartment
3 rooms
75 m2
2023-10-17
115 000 €1 150 € /m²(100 m²)
Sale
Apartment
3 rooms
100 m2
1 outbuilding
2022-12-23
105 000 €1 780 € /m²(59 m²)
Sale
House
4 rooms
59 m2
Land
432 m2
-Sols
Land
12 m2
-Sols
2021-10-11
50 000 €641 € /m²(78 m²)
Sale
Apartment
3 rooms
78 m2
2021-09-24
25 000 €694 € /m²(36 m²)
Sale
Apartment
1 room
36 m2
1 outbuilding
2021-05-03
65 350 €718 € /m²(91 m²)
Sale
Apartment
3 rooms
91 m2
1 outbuilding
2020-01-10
65 000 €1 016 € /m²(64 m²)
Sale
Apartment
3 rooms
64 m2
2019-09-13
7 750 €Sale
Land
9127 m2
-Prés
Land
2545 m2
-Taillis simples
Land
18253 m2
-Prés
Land
874 m2
-Taillis simples
Land
2530 m2
-Terres
Land
2860 m2
-Taillis simples
2019-06-20
35 000 €467 € /m²(75 m²)
Sale
House
4 rooms
75 m2
Land
628 m2
-Sols
Land
190 m2
-Prés
Land
93 m2
-Jardins
Land
55 m2
-Sols
Land
293 m2
-Sols
2018-09-26
161 000 €2 236 € /m²(72 m²)
Sale
House
2 rooms
72 m2
Land
537 m2
-Sols
Land
1565 m2
-Sols
Land
64 m2
-Sols
2017-01-17
45 000 €375 € /m²(120 m²)
Sale
Apartment
4 rooms
120 m2
1 outbuilding
2016-06-21
1 540 €Sale
Land
1390 m2
-Terres
Land
880 m2
-Terres
Land
7540 m2
-Taillis simples
2015-11-05
60 000 €659 € /m²(91 m²)
Sale
Apartment
3 rooms
91 m2
2015-10-23
6 000 €Sale
Land
1469 m2
-Prés
2015-08-21
73 000 €1 000 € /m²(73 m²)
Sale
House
3 rooms
73 m2
Land
295 m2
-Sols
2015-06-30
128 000 €1 407 € /m²(91 m²)
Sale
House
5 rooms
91 m2
Land
1467 m2
-Sols
2015-05-11
100 €Sale
Land
36 m2
-Sols
23 transactions listed in the municipality
Compare with neighboring municipalities
City
name
name
house
Price per m²
Price per m²
apt.
Price per m²
Price per m²
City information
Zip code
- 25250 FAIMBE
Data source & update
- Latest publication of the property value request (DVF) database made available by the DGFiP on October 19, 2025, covering transactions up to 06/30/2025:
- Administrative/cadastral division as of September 1, 2025, and municipal movements as of January 1, 2025: