Real estate price map
Real estate price map in the municipality of Chantrans, choose a section to see transactions by parcel.
Doubs (25)
Price per m² in Chantrans
Median price of real estate
in the municipality of Chantrans
Houses
970 € /m²
Reliability 4/10
Median price on the 10 transactions of the last 60 months.
Apartments
730 € /m²
Reliability 1/10
Median price on the 2 transactions of the last 120 months.
Dwellings
970 € /m²
Reliability 4/10
Median price on the 12 transactions of the last 60 months.
from 612 to
1 904 € /m²
1 904 € /m²
60% of transactions from the 2nd to the 8th deciles.
Yearly evolution
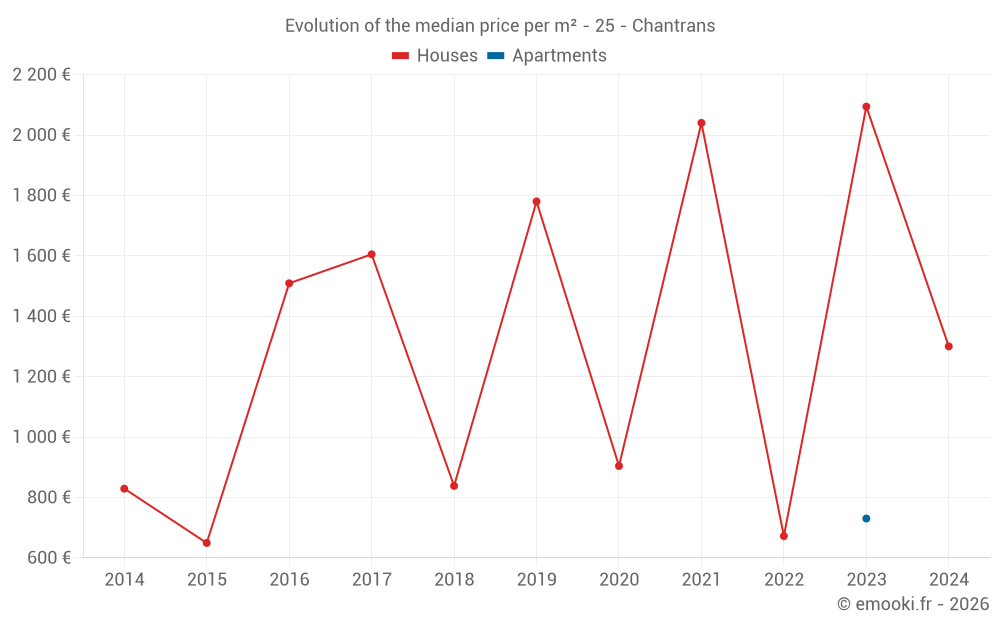
Evolution of the median price per m²
Evolution of the number of transactions
Warning, last year incomplete. Projections made based on the proportions between semesters of the previous year at the departmental/national level and by type of property.

Yearly data
Year
house
transactions
transactions
house
Price per m²
Price per m²
apt.
transactions
transactions
apt.
Price per m²
Price per m²
2025
0
--- €
0
--- €
2024
2
1 300 €
0
--- €
2023
1
2 094 €
2
730 €
2022
2
672 €
0
--- €
2021
2
2 040 €
0
--- €
2020
5
904 €
0
--- €
2019
1
1 780 €
0
--- €
2018
5
838 €
0
--- €
2017
2
1 605 €
0
--- €
2016
2
1 509 €
0
--- €
2015
2
649 €
0
--- €
2014
3
829 €
0
--- €
Analysis
Structure of prices per m²
Values of price percentiles per m² over the periods used for the estimated price of each type of property.
Structure of transaction amounts
Values of transaction amounts percentiles over the periods used for the estimated price of each type of property.
Transaction amounts and prices per m² by percentile
Percentile
house
Price per m²
Price per m²
house
Transaction amount
Transaction amount
apt.
Price per m²
Price per m²
apt.
Transaction amount
Transaction amount
10th percentile
558 €
43 850 €
407 €
53 720 €
20th percentile
733 €
76 420 €
488 €
70 940 €
30th percentile
857 €
101 K€
568 €
88 160 €
40th percentile
897 €
122 K€
649 €
105 K€
50th percentile
970 €
141 K€
730 €
123 K€
60th percentile
1 303 €
151 K€
811 €
140 K€
70th percentile
1 776 €
156 K€
892 €
157 K€
80th percentile
1 983 €
175 K€
972 €
174 K€
90th percentile
2 097 €
220 K€
1 053 €
191 K€
National and departmental comparison
Evolution of the median price per m² of houses
Evolution of the median price per m² of apartments
Quarterly evolution
Evolution of the median price per m²
Evolution of the number of transactions
Quarterly data
Quarter
house
transactions
transactions
house
Price per m²
Price per m²
apt.
transactions
transactions
apt.
Price per m²
Price per m²
2024 Q3
2
1 300 €
0
--- €
2023 Q4
0
--- €
1
1 134 €
2023 Q2
0
--- €
1
326 €
2023 Q1
1
2 094 €
0
--- €
2022 Q4
1
571 €
0
--- €
2022 Q2
1
774 €
0
--- €
2021 Q3
1
1 955 €
0
--- €
2021 Q1
1
2 124 €
0
--- €
2020 Q3
3
893 €
0
--- €
2020 Q2
1
2 238 €
0
--- €
2020 Q1
1
904 €
0
--- €
2019 Q2
1
1 780 €
0
--- €
2018 Q3
1
1 933 €
0
--- €
2018 Q2
3
543 €
0
--- €
2018 Q1
1
838 €
0
--- €
2017 Q3
1
946 €
0
--- €
2017 Q2
1
2 264 €
0
--- €
2016 Q3
2
1 509 €
0
--- €
2015 Q3
1
337 €
0
--- €
2015 Q2
1
961 €
0
--- €
2014 Q4
2
688 €
0
--- €
2014 Q2
1
1 408 €
0
--- €
Overview of the latest real estate transactions
The following list is an anonymized overview of the latest transactions. For more details and to find all transactions, please use the map to view transactions by plot or the transaction search page for a search by criteria.
2025-04-10
600 €Sale
Land
1592 m2
-Prés
2025-03-20
2 000 €Sale
Land
1312 m2
-Prés
Land
1313 m2
-Prés
Land
2153 m2
-Taillis simples
Land
2105 m2
-Taillis simples
Land
4143 m2
-Prés
Land
210 m2
-Taillis simples
2025-03-19
1 200 €Sale
Land
750 m2
-Taillis simples
Land
8490 m2
-Taillis simples
2025-02-14
77 973 €Sale
Land
813 m2
-Prés
Land
846 m2
-Prés
2025-01-02
9 314 €Sale
Land
17680 m2
-Terres
Land
27710 m2
-Prés
Land
1180 m2
-Landes
/Friche
Land
4950 m2
-Terres
Land
4240 m2
-Terres
2024-11-22
73 221 €Sale
Land
268 m2
-Prés
Land
790 m2
-Prés
Land
2434 m2
-Prés
2024-11-22
25 310 €Sale
Land
94 m2
-Prés
Land
2437 m2
-Prés
2024-09-10
22 000 €Sale
Land
940 m2
-Prés
Land
830 m2
-Taillis simples
Land
2077 m2
-Terres
Land
4153 m2
-Terres
Land
28360 m2
-Terres
Land
14180 m2
-Terres
2024-09-06
149 500 €1 699 € /m²(88 m²)
Sale
House
4 rooms
88 m2
1 outbuilding
Land
502 m2
-Sols
Land
516 m2
-Sols
2024-09-03
12 000 €Sale
Land
40 m2
-Sols
Land
108 m2
-Sols
2024-08-29
700 €Sale
Land
455 m2
-Prés
Land
549 m2
-Prés
2024-08-29
650 €Sale
Land
940 m2
-Taillis simples
2024-08-27
108 000 €900 € /m²(120 m²)
Sale
House
4 rooms
120 m2
Land
606 m2
-Sols
Land
32 m2
-Sols
2024-08-02
42 300 €Sale
Land
900 m2
-Prés
2024-07-26
2 000 €Sale
Land
6920 m2
-Taillis simples
2024-07-08
150 €Sale
Land
20 m2
-Sols
2024-04-11
650 €Sale
Land
880 m2
-Prés
2024-03-26
600 €Sale
Land
1790 m2
-Futaies résineuses
/EPICE
Land
1740 m2
-Taillis simples
2023-10-05
208 700 €1 134 € /m²(184 m²)
Sale
Apartment
4 rooms
126 m2
Apartment
1 room
58 m2
3 outbuildings
Land
1179 m2
-Sols
2023-09-27
1 000 €Sale
Land
1435 m2
-Prés
131 transactions listed in the municipality
Compare with neighboring municipalities
City
name
name
house
Price per m²
Price per m²
apt.
Price per m²
Price per m²
City information
Zip code
- 25330 CHANTRANS
Data source & update
- Latest publication of the property value request (DVF) database made available by the DGFiP on October 19, 2025, covering transactions up to 06/30/2025:
- Administrative/cadastral division as of September 1, 2025, and municipal movements as of January 1, 2025: