emooki
HomePrice mapTransactions
🇬🇧 English🇫🇷 Français🇩🇪 Deutsch🇪🇸 Español🇮🇹 Italiano

Real estate price map


Real estate price map in the municipality of Saint-Satur, choose a section to see transactions by parcel.

Cher (18)

Saint-Satur - Real estate price m²

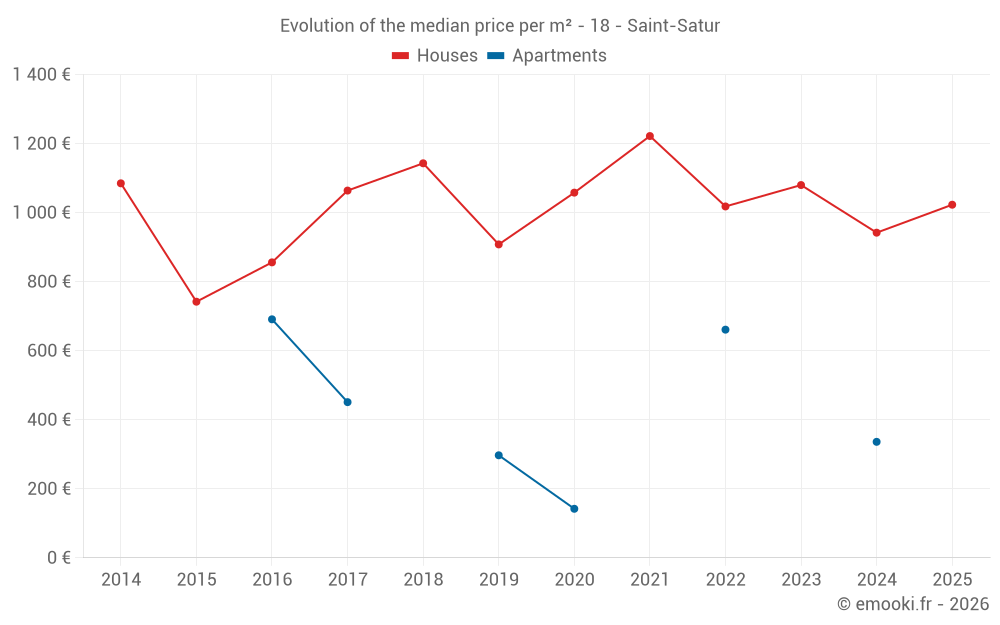
Median price of real estate
in the municipality of Saint-Satur

HousesHouses
1 056  /m²
1-23-45-67-89-10
Reliability 8/10
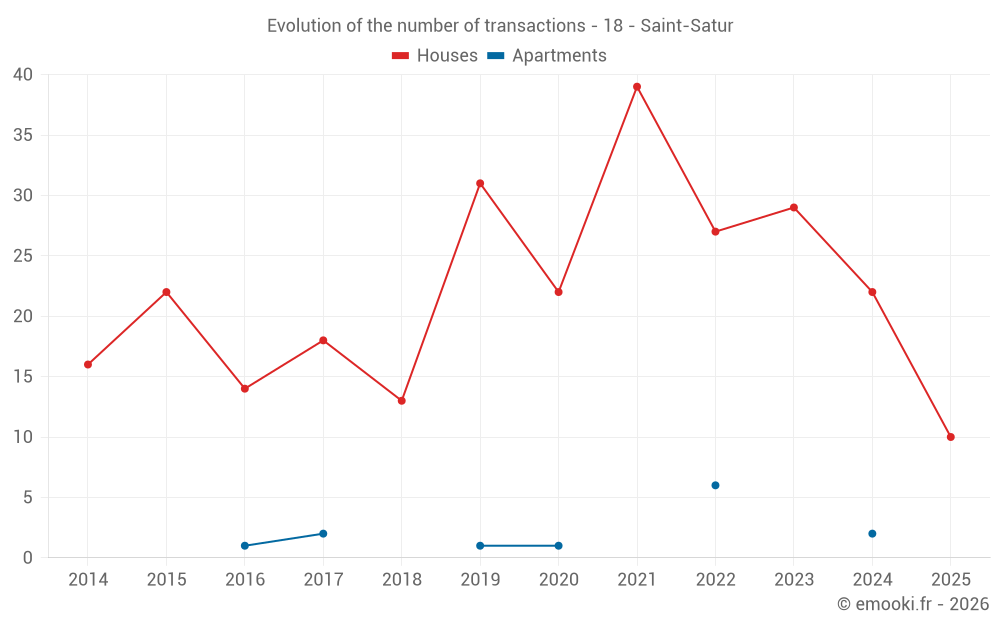
Median price on the 22 transactions of the last 12 months.
from 602 to
1 441  /m²
60% of transactions from the 2nd to the 8th deciles.
ApartmentsApartments
549  /m²
1-23-45-67-89-10
Reliability 4/10
Median price on the 8 transactions of the last 60 months.
DwellingsDwellings
1 056  /m²
1-23-45-67-89-10
Reliability 8/10
Median price on the 23 transactions of the last 12 months.
from 589 to
1 420  /m²
60% of transactions from the 2nd to the 8th deciles.
HousesEvolution of the price per m² of houses since...
1 year
+8.6%
2 years
-5.3%
3 years
+0.5%
4 years
-16%
5 years
-3.3%
6 years
+13%
7 years
-10%
8 years
-3.9%
9 years
+20%
10 years
+38%
11 years
-5.7%
The price per m² of houses has decreased by 16% since 4 years, but it has increased by 38% in 10 years.

Yearly evolution

Evolution of the median price per m²

Evolution of the median price per m² - 18 - Saint-Satur

Evolution of the number of transactions

Warning, last year incomplete. Projections made based on the proportions between semesters of the previous year at the departmental/national level and by type of property.

Evolution of the number of transactions - 18 - Saint-Satur

Yearly data

Descending order
Year
Houses
house
transactions
Houses
house
Price per m²
Apartments
apt.
transactions
Apartments
apt.
Price per m²
2025
10
1 023 
0
--- 
2024
22
942 
2
336 
2023
29
1 080 
0
--- 
2022
27
1 018 
6
661 
2021
39
1 222 
0
--- 
2020
22
1 058 
1
142 
2019
31
908 
1
297 
2018
13
1 143 
0
--- 
2017
18
1 064 
2
451 
2016
14
856 
1
691 
2015
22
742 
0
--- 
2014
16
1 085 
0
--- 

Analysis

Structure of prices per m²

Values of price percentiles per m² over the periods used for the estimated price of each type of property.

Structure of transaction amounts

Values of transaction amounts percentiles over the periods used for the estimated price of each type of property.

Transaction amounts and prices per m² by percentile

Ascending order
Percentile
Houses
house
Price per m²
Houses
house
Transaction amount
Apartments
apt.
Price per m²
Apartments
apt.
Transaction amount
10th percentile
462 
39 600 
138 
12 000 
20th percentile
602 
60 200 
249 
18 600 
30th percentile
758 
66 500 
394 
27 100 
40th percentile
951 
72 210 
487 
48 800 
50th percentile
1 056 
95 000 
549 
58 250 
60th percentile
1 160 
108 K
630 
67 200 
70th percentile
1 292 
110 K
787 
87 150 
80th percentile
1 441 
134 K
810 
94 800 
90th percentile
1 912 
182 K
811 
131 K

National and departmental comparison

Evolution of the median price per m² of houses

Evolution of the median price per m² of apartments

Quarterly evolution

Evolution of the median price per m²

Evolution of the number of transactions

Quarterly data

Descending order
Quarter
Houses
house
transactions
Houses
house
Price per m²
Apartments
apt.
transactions
Apartments
apt.
Price per m²
2025 Q2
5
565 
0
--- 
2025 Q1
5
1 644 
0
--- 
2024 Q4
8
1 056 
0
--- 
2024 Q3
4
973 
1
585 
2024 Q2
6
527 
0
--- 
2024 Q1
4
1 090 
1
86 
2023 Q4
8
1 142 
0
--- 
2023 Q3
7
1 050 
0
--- 
2023 Q2
6
1 098 
0
--- 
2023 Q1
8
1 176 
0
--- 
2022 Q4
3
1 804 
0
--- 
2022 Q3
8
793 
3
811 
2022 Q2
5
1 018 
1
381 
2022 Q1
11
1 041 
2
337 
2021 Q4
7
1 222 
0
--- 
2021 Q3
11
1 308 
0
--- 
2021 Q2
12
1 294 
0
--- 
2021 Q1
9
941 
0
--- 
2020 Q4
9
971 
0
--- 
2020 Q3
5
945 
0
--- 
2020 Q2
3
714 
0
--- 
2020 Q1
5
1 324 
1
142 
2019 Q4
8
1 099 
1
297 
2019 Q3
5
1 042 
0
--- 
2019 Q2
9
622 
0
--- 
2019 Q1
9
1 146 
0
--- 
2018 Q4
4
1 033 
0
--- 
2018 Q3
5
1 200 
0
--- 
2018 Q2
2
894 
0
--- 
2018 Q1
2
794 
0
--- 
2017 Q4
5
1 011 
0
--- 
2017 Q3
3
1 042 
0
--- 
2017 Q2
4
1 315 
1
133 
2017 Q1
6
1 262 
1
769 
2016 Q4
6
740 
1
691 
2016 Q3
2
1 211 
0
--- 
2016 Q2
3
875 
0
--- 
2016 Q1
3
883 
0
--- 
2015 Q4
5
667 
0
--- 
2015 Q3
9
758 
0
--- 
2015 Q2
2
441 
0
--- 
2015 Q1
6
1 216 
0
--- 
2014 Q4
5
1 519 
0
--- 
2014 Q3
2
1 144 
0
--- 
2014 Q2
8
808 
0
--- 
2014 Q1
1
1 051 
0
--- 

Overview of the latest real estate transactions

The following list is an anonymized overview of the latest transactions. For more details and to find all transactions, please use the map to view transactions by plot or the transaction search page for a search by criteria.

2025-06-24
61 000 
1 356  /m²(45 m²)
Sale
Houses
House
1 room
45 m2
1 outbuilding
Land
117 m2
-Sols
Land
145 m2
-Terres
2025-06-18
60 000 
594  /m²(101 m²)
Sale
Houses
House
6 rooms
101 m2
Land
759 m2
-Sols
Land
312 m2
-Vergers
/Familial (jardin)
Land
596 m2
-Terres
Land
410 m2
-Terrains d'agrément
Land
450 m2
-Terres
2025-05-19
45 000 
450  /m²(100 m²)
Sale
2 outbuildings
Land
36 m2
-Sols
Houses
House
4 rooms
100 m2
Land
107 m2
-Sols
Land
13 m2
-Sols
Land
3 m2
-Sols
2025-04-29
39 000 
565  /m²(69 m²)
Sale
Houses
House
4 rooms
69 m2
Land
726 m2
-Sols
2025-04-24
12 000 
Sale
1 outbuilding
Land
35 m2
-Sols
2025-04-16
35 000 
389  /m²(90 m²)
Sale
Houses
House
2 rooms
45 m2
Houses
House
2 rooms
45 m2
Land
170 m2
-Sols
2025-03-25
4 500 
Exchange
Land
306 m2
-Terres
Land
306 m2
-Vignes
/Vins d'appellation d'origine contrôlée
2025-03-18
700 
Sale
Land
2109 m2
-Terres
2025-02-28
140 000 
2 258  /m²(62 m²)
Sale
Houses
House
4 rooms
62 m2
1 outbuilding
Land
236 m2
-Sols
2025-02-28
185 000 
2 313  /m²(80 m²)
Sale
Houses
House
3 rooms
80 m2
1 outbuilding
Land
258 m2
-Sols
Land
125 m2
-Sols
Land
172 m2
-Jardins
Land
145 m2
-Sols
Land
13 m2
-Sols
Land
176 m2
-Jardins
2025-02-27
60 000 
Sale
Land
1480 m2
-Vignes
/Vins d'appellation d'origine contrôlée
Land
1265 m2
-Vignes
/Vins d'appellation d'origine contrôlée
Land
358 m2
-Vignes
/Vins d'appellation d'origine contrôlée
2025-02-14
107 000 
947  /m²(113 m²)
Sale
2 outbuildings
Land
76 m2
-Sols
Houses
House
4 rooms
113 m2
Land
59 m2
-Sols
Land
255 m2
-Jardins
2025-02-14
70 350 
1 099  /m²(64 m²)
Sale
Houses
House
2 rooms
64 m2
1 outbuilding
Land
537 m2
-Sols
Land
53 m2
-Sols
Land
96 m2
-Sols
2025-02-14
100 000 
855  /m²(117 m²)
2 326  /m²(43 m²)
Sale
Houses
House
2 rooms
43 m2
Commercial property
8 m2
Commercial property
66 m2
Land
179 m2
-Sols
2025-02-07
3 800 
Sale
Land
582 m2
-Terres
2025-01-09
5 390 500 
1 451  /m²(3716 m²)
Sale
Commercial property
3256 m2
Commercial property
460 m2
Land
6679 m2
-Sols
Land
447 m2
-Prés
Land
570 m2
-Sols
Land
554 m2
-Sols
Land
550 m2
-Terres
Land
167 m2
-Sols
Land
40 m2
-Sols
Land
203 m2
-Sols
2025-01-06
314 000 
1 644  /m²(191 m²)
Sale
Houses
House
8 rooms
191 m2
Land
1050 m2
-Sols
2024-12-27
300 000 
1 056  /m²(284 m²)
Sale
Houses
House
4 rooms
90 m2
Land
83 m2
-Sols
Houses
House
4 rooms
84 m2
Land
75 m2
-Sols
1 outbuilding
Land
62 m2
-Sols
Houses
House
4 rooms
110 m2
1 outbuilding
Land
102 m2
-Sols
Land
237 m2
-Jardins
Land
79 m2
-Jardins
Land
240 m2
-Jardins
Land
30 m2
-Sols
2024-12-20
27 400 
685  /m²(40 m²)
Sale
Houses
House
2 rooms
40 m2
Land
67 m2
-Sols
Land
93 m2
-Jardins
Land
18 m2
-Sols
2024-12-20
101 000 
1 942  /m²(52 m²)
Sale
Houses
House
3 rooms
52 m2
Land
620 m2
-Sols
Land
529 m2
-Sols
Land
2 m2
-Jardins
Land
69 m2
-Jardins
486 transactions listed in the municipality

Cher (18)

Most expensive cities

City
name
Descending orderHouses
house
Price per m²
1 902 
1 892 
1 870 
1 810 
1 764 
1 730 
1 700 
1 692 
City
name
Descending orderApartments
apt.
Price per m²
28 462 
2 682 
1 718 
1 663 
1 623 
1 498 
1 444 
1 291 

Least expensive cities

City
name
Ascending orderHouses
house
Price per m²
404 
427 
526 
556 
563 
563 
City
name
Ascending orderApartments
apt.
Price per m²
26 
31 
135 
156