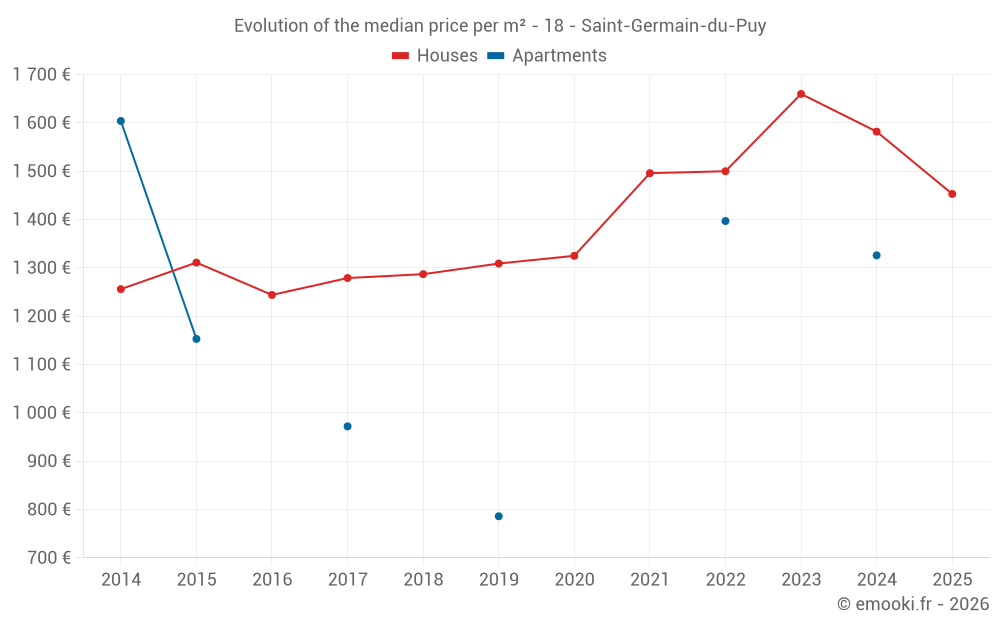
Median price of real estate
in the municipality of Saint-Germain-du-Puy
Houses
1 453 € /m²
Reliability 9/10
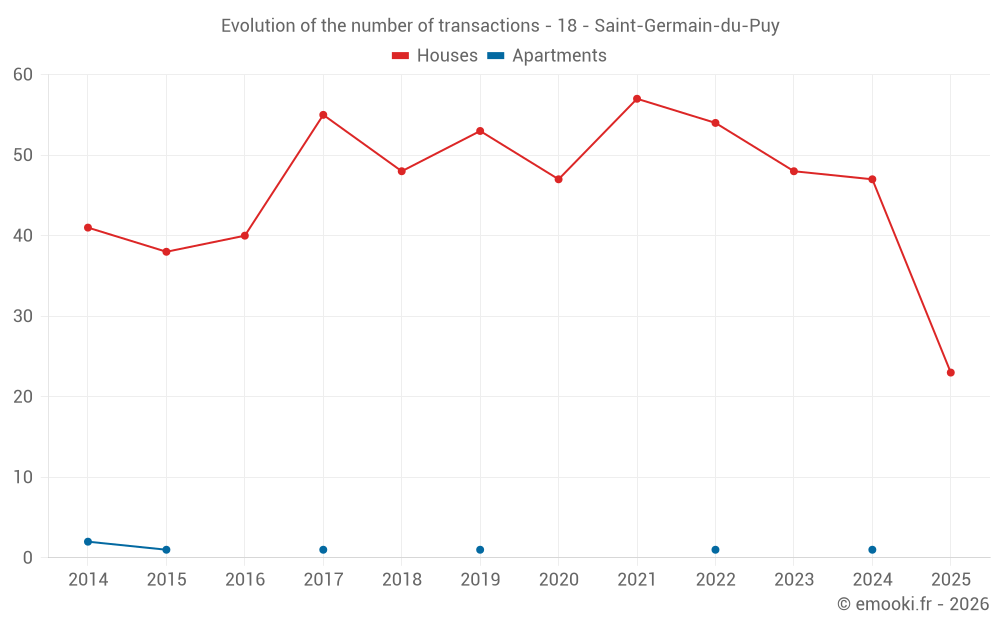
Median price on the 23 transactions of the last 6 months.
from 1 128 to
1 868 € /m²
1 868 € /m²
60% of transactions from the 2nd to the 8th deciles.
Apartments
1 149 € /m²
Reliability 2/10
Median price on the 4 transactions of the last 96 months.
Dwellings
1 453 € /m²
Reliability 9/10
Median price on the 23 transactions of the last 6 months.
from 1 128 to
1 868 € /m²
1 868 € /m²
60% of transactions from the 2nd to the 8th deciles.