Real estate price map
Real estate price map in the municipality of Saint-Pierre-en-Auge, choose a section to see transactions by parcel.
Price per m² in Saint-Pierre-en-Auge
Median price of real estate
in the municipality of Saint-Pierre-en-Auge
2 068 € /m²
1 428 € /m²
2 047 € /m²
1863 transactions listed in the municipality
Yearly data
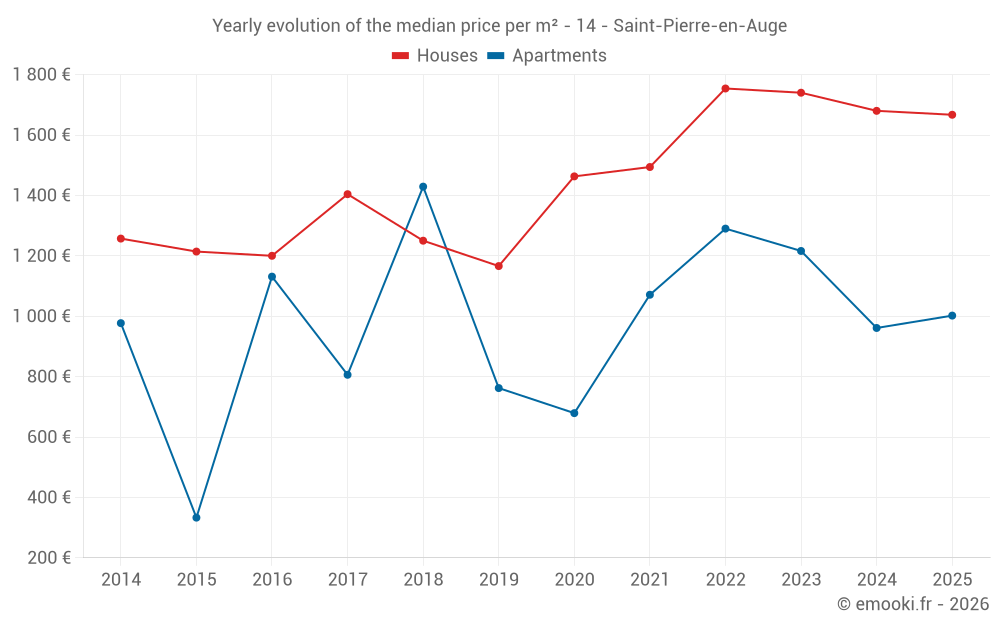
Yearly evolution of the median price per m²
Yearly evolution of the number of transactions
Warning, last year incomplete. Projections made based on the proportions between semesters of the previous year at the departmental/national level and by type of property.

Yearly table
transactions
Price per m²
transactions
Price per m²
Analysis
Structure of prices per m²
Values of price percentiles per m² over the periods used for the estimated price of each type of property.
Structure of transaction amounts
Values of transaction amounts percentiles over the periods used for the estimated price of each type of property.
Transaction amounts and prices per m² by percentile
Price per m²
Transaction amount
Price per m²
Transaction amount
National and departmental comparison
Evolution of the median price per m² of houses
Evolution of the median price per m² of apartments
Quarterly data
Quarterly evolution of the median price per m²
Quarterly evolution of the number of transactions
Quarterly table
transactions
Price per m²
transactions
Price per m²
Key takeaways
What is the price per m2 of houses in Saint-Pierre-en-Auge?
The median price on the 29 house transactions of the last 6 months in the municipality of Saint-Pierre-en-Auge was 1 667 € per square meter for a median property value of 190 000 €. Over this period, 60% of transactions were between 1 337 and 2 068 € per square meter (from the 2nd to the 8th deciles).
Compare with neighboring municipalities
name
Price per m²
Price per m²
City information
Zip codes
- MONTVIETTE 14140 ST PIERRE EN AUGE
- STE MARGUERITE DE VIETTE 14140 ST PIERRE EN AUGE
- ST GEORGES EN AUGE 14140 ST PIERRE EN AUGE
- VIEUX PONT EN AUGE 14140 ST PIERRE EN AUGE
- AMMEVILLE 14170 ST PIERRE EN AUGE
- BERVILLE 14170 ST PIERRE EN AUGE
- BOISSEY 14170 ST PIERRE EN AUGE
- BRETTEVILLE SUR DIVES 14170 ST PIERRE EN AUGE
- ECOTS 14170 ST PIERRE EN AUGE
- GARNETOT 14170 ST PIERRE EN AUGE
- GRANDMESNIL 14170 ST PIERRE EN AUGE
- HIEVILLE 14170 ST PIERRE EN AUGE
- LIEURY 14170 ST PIERRE EN AUGE
- L OUDON 14170 ST PIERRE EN AUGE
- MITTOIS 14170 ST PIERRE EN AUGE
- MONTPINCON 14170 ST PIERRE EN AUGE
- OUVILLE LA BIEN TOURNEE 14170 ST PIERRE EN AUGE
- ST MARTIN DE FRESNAY 14170 ST PIERRE EN AUGE
- ST PIERRE SUR DIVES 14170 ST PIERRE EN AUGE
- THIEVILLE 14170 ST PIERRE EN AUGE
- TOTES 14170 ST PIERRE EN AUGE
- VAUDELOGES 14170 ST PIERRE EN AUGE