Real estate price map
Real estate price map in the municipality of Livarot-Pays-d'Auge, choose a section to see transactions by parcel.
Price per m² in Livarot-Pays-d'Auge
Median price of real estate
in the municipality of Livarot-Pays-d'Auge
2 245 € /m²
2 245 € /m²
1803 transactions listed in the municipality
Yearly data
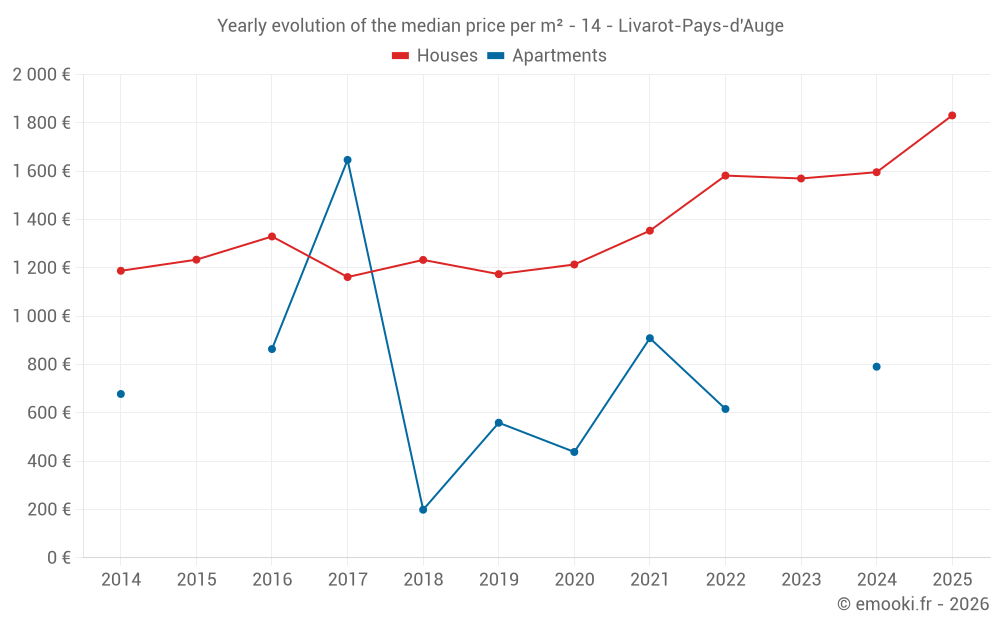
Yearly evolution of the median price per m²
Yearly evolution of the number of transactions
Warning, last year incomplete. Projections made based on the proportions between semesters of the previous year at the departmental/national level and by type of property.

Yearly table
transactions
Price per m²
transactions
Price per m²
Analysis
Structure of prices per m²
Values of price percentiles per m² over the periods used for the estimated price of each type of property.
Structure of transaction amounts
Values of transaction amounts percentiles over the periods used for the estimated price of each type of property.
Transaction amounts and prices per m² by percentile
Price per m²
Transaction amount
Price per m²
Transaction amount
National and departmental comparison
Evolution of the median price per m² of houses
Evolution of the median price per m² of apartments
Quarterly data
Quarterly evolution of the median price per m²
Quarterly evolution of the number of transactions
Quarterly table
transactions
Price per m²
transactions
Price per m²
Key takeaways
What is the price per m2 of houses in Livarot-Pays-d'Auge?
The median price on the 27 house transactions of the last 6 months in the municipality of Livarot-Pays-d'Auge was 1 831 € per square meter for a median property value of 200 000 €. Over this period, 60% of transactions were between 1 033 and 2 245 € per square meter (from the 2nd to the 8th deciles).
Compare with neighboring municipalities
name
Price per m²
Price per m²
City information
Zip codes
- AUQUAINVILLE 14140 LIVAROT PAYS D AUGE
- BELLOU 14140 LIVAROT PAYS D AUGE
- CHEFFREVILLE TONNENCOURT 14140 LIVAROT PAYS D AUGE
- FERVAQUES 14140 LIVAROT PAYS D AUGE
- HEURTEVENT 14140 LIVAROT PAYS D AUGE
- LA CROUPTE 14140 LIVAROT PAYS D AUGE
- LE MESNIL BACLEY 14140 LIVAROT PAYS D AUGE
- LE MESNIL DURAND 14140 LIVAROT PAYS D AUGE
- LE MESNIL GERMAIN 14140 LIVAROT PAYS D AUGE
- LES AUTELS ST BAZILE 14140 LIVAROT PAYS D AUGE
- LES MOUTIERS HUBERT 14140 LIVAROT PAYS D AUGE
- LIVAROT 14140 LIVAROT PAYS D AUGE
- NOTRE DAME DE COURSON 14140 LIVAROT PAYS D AUGE
- STE MARGUERITE DES LOGES 14140 LIVAROT PAYS D AUGE
- ST MARTIN DU MESNIL OURY 14140 LIVAROT PAYS D AUGE
- ST MICHEL DE LIVET 14140 LIVAROT PAYS D AUGE
- ST OUEN LE HOUX 14140 LIVAROT PAYS D AUGE
- TORTISAMBERT 14140 LIVAROT PAYS D AUGE
- CERQUEUX 14290 LIVAROT PAYS D AUGE
- FAMILLY 14290 LIVAROT PAYS D AUGE
- MEULLES 14290 LIVAROT PAYS D AUGE
- PREAUX ST SEBASTIEN 14290 LIVAROT PAYS D AUGE