emooki
HomePrice mapTransactions
🇬🇧 English🇫🇷 Français🇩🇪 Deutsch🇪🇸 Español🇮🇹 Italiano

Real estate price map


Real estate price map in the municipality of Épron, choose a section to see transactions by parcel.

Calvados (14)
Épron

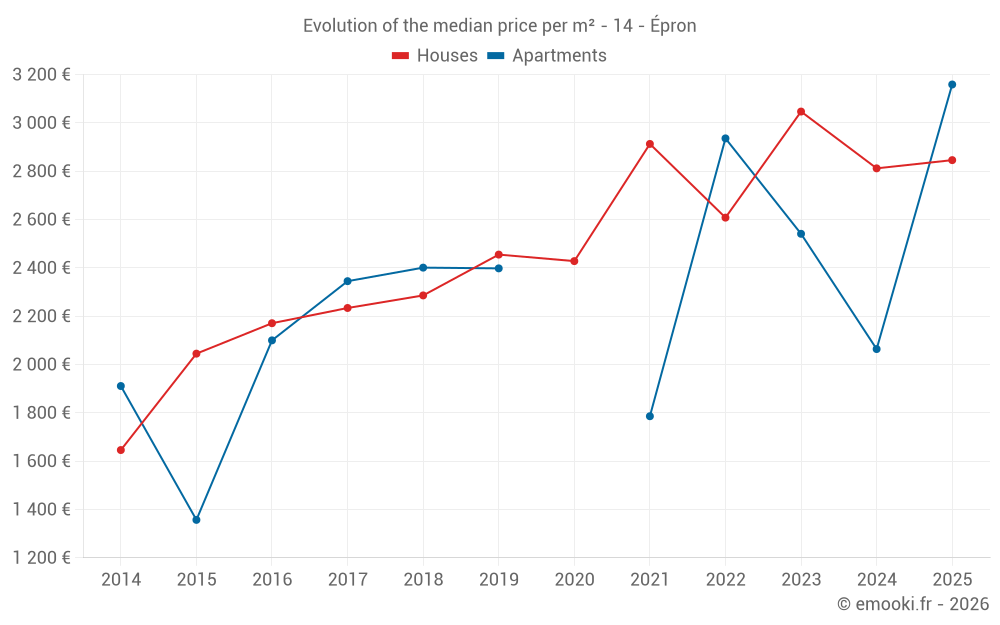
Median price of real estate
in the municipality of Épron

HousesHouses
3 002  /m²
1-23-45-67-89-10
Reliability 7/10
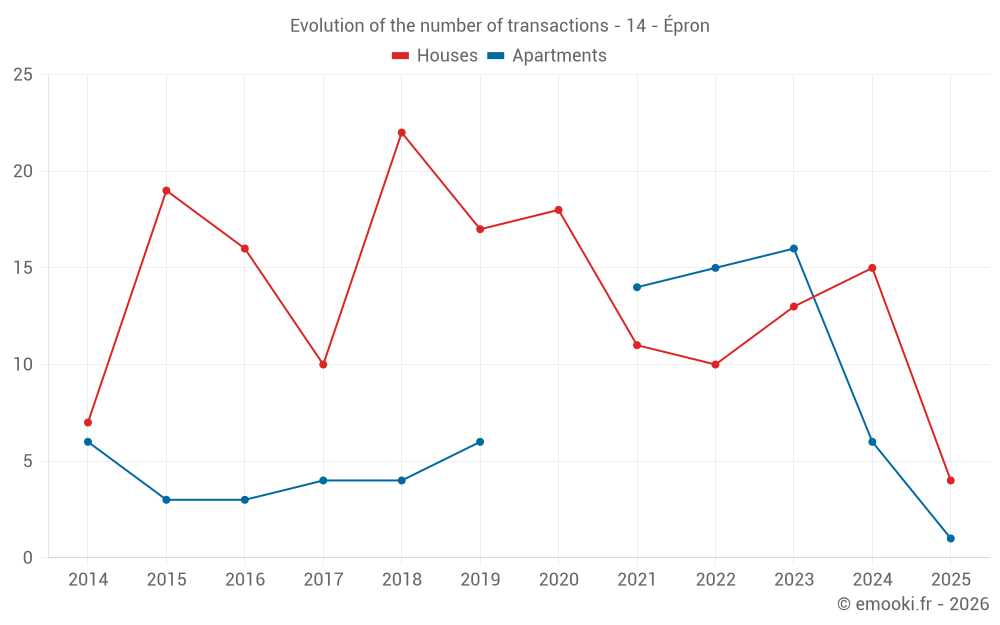
Median price on the 27 transactions of the last 24 months.
from 2 563 to
3 618  /m²
60% of transactions from the 2nd to the 8th deciles.
ApartmentsApartments
2 365  /m²
1-23-45-67-89-10
Reliability 7/10
Median price on the 17 transactions of the last 24 months.
from 1 397 to
3 312  /m²
60% of transactions from the 2nd to the 8th deciles.
DwellingsDwellings
3 016  /m²
1-23-45-67-89-10
Reliability 8/10
Median price on the 16 transactions of the last 12 months.
from 2 537 to
3 621  /m²
60% of transactions from the 2nd to the 8th deciles.
HousesEvolution of the price per m² of houses since...
1 year
+1.2%
2 years
-6.6%
3 years
+9.1%
4 years
-2.3%
5 years
+17%
6 years
+16%
7 years
+24%
8 years
+27%
9 years
+31%
10 years
+39%
11 years
+73%
The price per m² of houses has decreased by 6.6% since 2 years, but it has increased by 73% in 11 years.

Yearly evolution

Evolution of the median price per m²

Evolution of the number of transactions

Warning, last year incomplete. Projections made based on the proportions between semesters of the previous year at the departmental/national level and by type of property.

Yearly data

Descending order
Year
Houses
house
transactions
Houses
house
Price per m²
Apartments
apt.
transactions
Apartments
apt.
Price per m²
2025
4
2 846 
1
3 159 
2024
15
2 812 
6
2 064 
2023
13
3 047 
16
2 541 
2022
10
2 608 
15
2 936 
2021
11
2 913 
14
1 786 
2020
18
2 428 
0
--- 
2019
17
2 455 
6
2 398 
2018
22
2 286 
4
2 401 
2017
10
2 234 
4
2 345 
2016
16
2 171 
3
2 100 
2015
19
2 045 
3
1 357 
2014
7
1 646 
6
1 911 

Analysis

Structure of prices per m²

Values of price percentiles per m² over the periods used for the estimated price of each type of property.

Structure of transaction amounts

Values of transaction amounts percentiles over the periods used for the estimated price of each type of property.

Transaction amounts and prices per m² by percentile

Ascending order
Percentile
Houses
house
Price per m²
Houses
house
Transaction amount
Apartments
apt.
Price per m²
Apartments
apt.
Transaction amount
10th percentile
2 383 
237 K
1 110 
64 680 
20th percentile
2 563 
273 K
1 397 
90 187 
30th percentile
2 690 
315 K
1 587 
113 K
40th percentile
2 812 
325 K
1 993 
120 K
50th percentile
3 002 
334 K
2 365 
124 K
60th percentile
3 076 
379 K
2 787 
137 K
70th percentile
3 455 
410 K
3 001 
149 K
80th percentile
3 618 
424 K
3 312 
199 K
90th percentile
4 005 
512 K
3 850 
227 K

National and departmental comparison

Evolution of the median price per m² of houses

Evolution of the median price per m² of apartments

Quarterly evolution

Evolution of the median price per m²

Evolution of the number of transactions

Quarterly data

Descending order
Quarter
Houses
house
transactions
Houses
house
Price per m²
Apartments
apt.
transactions
Apartments
apt.
Price per m²
2025 Q2
3
3 002 
0
--- 
2025 Q1
1
1 942 
1
3 159 
2024 Q4
4
3 127 
0
--- 
2024 Q3
4
3 145 
3
2 365 
2024 Q2
3
2 411 
1
1 350 
2024 Q1
4
2 751 
2
1 833 
2023 Q4
3
3 429 
6
1 962 
2023 Q3
5
3 047 
4
3 448 
2023 Q2
3
3 228 
2
1 783 
2023 Q1
2
2 388 
4
3 245 
2022 Q4
1
3 080 
3
3 675 
2022 Q3
6
2 668 
3
4 065 
2022 Q2
1
2 478 
8
2 716 
2022 Q1
2
2 432 
1
3 569 
2021 Q4
4
2 862 
5
2 697 
2021 Q3
4
3 000 
4
1 453 
2021 Q2
3
2 715 
4
1 795 
2021 Q1
0
--- 
1
2 824 
2020 Q4
3
2 339 
0
--- 
2020 Q3
8
2 490 
0
--- 
2020 Q2
3
2 563 
0
--- 
2020 Q1
4
2 244 
0
--- 
2019 Q4
4
2 374 
1
2 768 
2019 Q3
9
2 455 
3
2 625 
2019 Q2
3
2 455 
0
--- 
2019 Q1
1
2 688 
2
1 992 
2018 Q4
4
1 902 
1
3 315 
2018 Q3
6
2 465 
1
2 500 
2018 Q2
5
1 931 
1
2 235 
2018 Q1
7
2 213 
1
2 302 
2017 Q4
3
2 536 
0
--- 
2017 Q3
2
2 355 
2
2 450 
2017 Q2
3
2 414 
0
--- 
2017 Q1
2
1 664 
2
2 314 
2016 Q4
5
1 923 
0
--- 
2016 Q3
6
2 434 
2
1 567 
2016 Q2
3
2 189 
1
2 100 
2016 Q1
2
2 153 
0
--- 
2015 Q4
2
2 056 
0
--- 
2015 Q3
9
2 065 
2
1 732 
2015 Q2
4
2 170 
0
--- 
2015 Q1
4
1 776 
1
1 053 
2014 Q4
2
1 741 
4
1 663 
2014 Q3
3
1 646 
0
--- 
2014 Q2
2
1 923 
1
2 150 
2014 Q1
0
--- 
1
2 394 

Overview of the latest real estate transactions

The following list is an anonymized overview of the latest transactions. For more details and to find all transactions, please use the map to view transactions by plot or the transaction search page for a search by criteria.

2025-06-05
413 000 
3 560  /m²(116 m²)
Sale
Houses
House
5 rooms
116 m2
Land
622 m2
-Sols
2025-04-29
3 511 123 
Sale
Land
4584 m2
-Terres
Land
5078 m2
-Terres
Land
741 m2
-Terres
Land
27683 m2
-Terres
Land
1496 m2
-Terres
Land
1429 m2
-Terres
Land
4709 m2
-Terres
Land
1870 m2
-Terres
Land
229 m2
-Terres
Land
127 m2
-Terres
Land
22782 m2
-Terres
Land
2173 m2
-Terres
Land
141 m2
-Sols
Land
891 m2
-Terres
Land
1091 m2
-Terres
2025-04-17
486 350 
3 002  /m²(162 m²)
Sale
Houses
House
6 rooms
162 m2
Land
694 m2
-Sols
2025-04-16
285 000 
2 689  /m²(106 m²)
Sale
Houses
House
6 rooms
106 m2
Land
654 m2
-Sols
2025-03-27
350 000 
900  /m²(389 m²)
Sale
Commercial property
389 m2
2025-03-21
14 500 
Sale
2 outbuildings
1 outbuilding
2025-03-19
233 000 
1 942  /m²(120 m²)
Sale
Houses
House
5 rooms
120 m2
Land
784 m2
-Sols
2025-03-13
15 000 
Sale
3 outbuildings
2025-02-13
139 000 
3 159  /m²(44 m²)
Sale
Apartments
Apartment
2 rooms
44 m2
2 outbuildings
2024-12-13
55 000 
1 774  /m²(31 m²)
Sale
Commercial property
31 m2
2024-11-14
421 200 
5 075  /m²(83 m²)
Sale
Houses
House
4 rooms
83 m2
Land
549 m2
-Sols
2024-10-30
1 010 972 
Sale
Land
1 m2
-Terres
Land
4027 m2
-Terres
2024-10-28
425 000 
2 690  /m²(158 m²)
Sale
Houses
House
7 rooms
158 m2
Land
426 m2
-Sols
2024-10-25
394 000 
3 031  /m²(130 m²)
Sale
Houses
House
4 rooms
130 m2
Land
689 m2
-Sols
2024-10-03
332 000 
3 223  /m²(103 m²)
Sale
Houses
House
6 rooms
103 m2
Land
584 m2
-Sols
2024-09-26
12 000 
Sale
1 outbuilding
2024-08-30
580 000 
3 625  /m²(160 m²)
Sale
Land
32 m2
-Sols
Land
78 m2
-Sols
Land
178 m2
-Sols
Houses
House
7 rooms
160 m2
2 outbuildings
Land
354 m2
-Sols
2024-08-29
315 000 
3 621  /m²(87 m²)
Sale
Houses
House
4 rooms
87 m2
Land
352 m2
-Sols
2024-08-27
299 633 
3 793  /m²(79 m²)
Sale
3 outbuildings
Apartments
Apartment
4 rooms
79 m2
2024-08-06
201 000 
2 365  /m²(85 m²)
Sale
Apartments
Apartment
4 rooms
85 m2
3 outbuildings

Calvados (14)

Most expensive cities

City
name
Descending orderHouses
house
Price per m²
6 297 
5 823 
5 346 
5 102 
5 042 
5 040 
4 875 
City
name
Descending orderApartments
apt.
Price per m²
6 532 
6 000 
5 056 
4 667 
4 332 
4 307 
4 287 

Least expensive cities

City
name
Ascending orderHouses
house
Price per m²
643 
948 
960 
968 
City
name
Ascending orderApartments
apt.
Price per m²
407 
545 
556