emooki
HomePrice mapTransactions
🇬🇧 English🇫🇷 Français🇩🇪 Deutsch🇪🇸 Español🇮🇹 Italiano

Real estate price map


Real estate price map in the municipality of Cambes-en-Plaine, choose a section to see transactions by parcel.

Calvados (14)

Cambes-en-Plaine - Real estate price m²

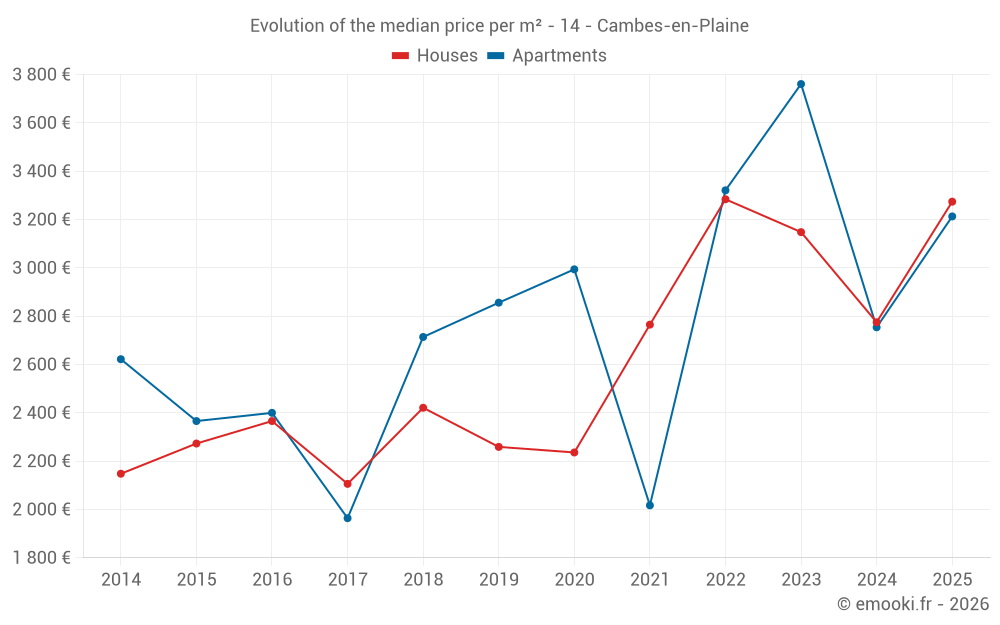
Median price of real estate
in the municipality of Cambes-en-Plaine

HousesHouses
2 983  /m²
1-23-45-67-89-10
Reliability 8/10
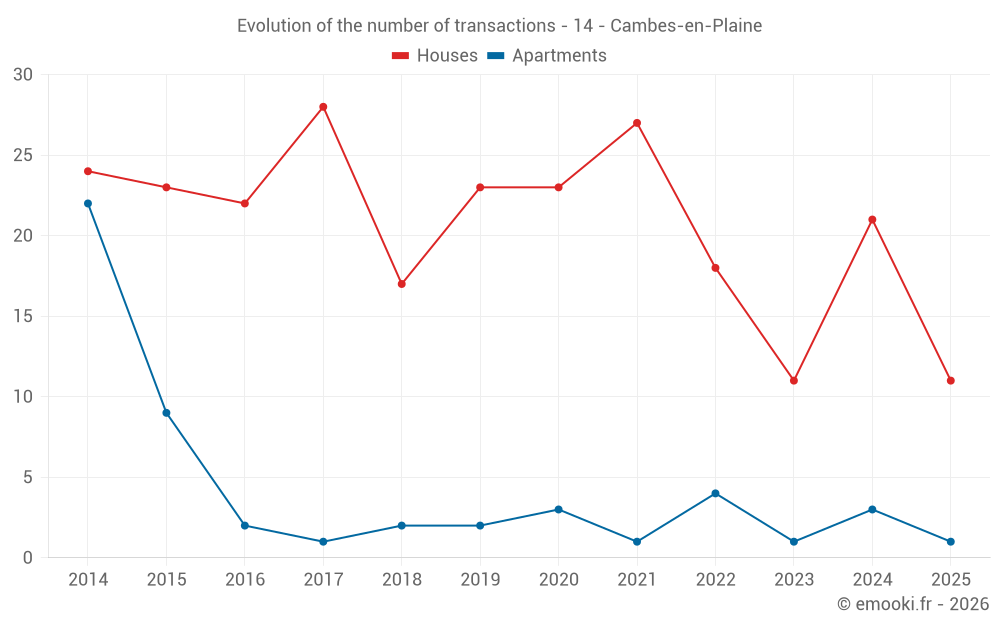
Median price on the 27 transactions of the last 12 months.
from 2 503 to
3 296  /m²
60% of transactions from the 2nd to the 8th deciles.
ApartmentsApartments
3 131  /m²
1-23-45-67-89-10
Reliability 5/10
Median price on the 10 transactions of the last 48 months.
DwellingsDwellings
2 906  /m²
1-23-45-67-89-10
Reliability 8/10
Median price on the 30 transactions of the last 12 months.
from 2 512 to
3 282  /m²
60% of transactions from the 2nd to the 8th deciles.
HousesEvolution of the price per m² of houses since...
1 year
+18%
2 years
+4%
3 years
-0.3%
4 years
+18%
5 years
+46%
6 years
+45%
7 years
+35%
8 years
+55%
9 years
+38%
10 years
+44%
11 years
+52%
The price per m² of houses has decreased by 0.3% since 3 years, but it has increased by 55% in 8 years.

Yearly evolution

Evolution of the median price per m²

Evolution of the median price per m² - 14 - Cambes-en-Plaine

Evolution of the number of transactions

Warning, last year incomplete. Projections made based on the proportions between semesters of the previous year at the departmental/national level and by type of property.

Evolution of the number of transactions - 14 - Cambes-en-Plaine

Yearly data

Descending order
Year
Houses
house
transactions
Houses
house
Price per m²
Apartments
apt.
transactions
Apartments
apt.
Price per m²
2025
11
3 274 
1
3 213 
2024
21
2 775 
3
2 754 
2023
11
3 148 
1
3 761 
2022
18
3 284 
4
3 321 
2021
27
2 765 
1
2 017 
2020
23
2 236 
3
2 994 
2019
23
2 259 
2
2 856 
2018
17
2 421 
2
2 714 
2017
28
2 106 
1
1 964 
2016
22
2 366 
2
2 400 
2015
23
2 273 
9
2 366 
2014
24
2 148 
22
2 622 

Analysis

Structure of prices per m²

Values of price percentiles per m² over the periods used for the estimated price of each type of property.

Structure of transaction amounts

Values of transaction amounts percentiles over the periods used for the estimated price of each type of property.

Transaction amounts and prices per m² by percentile

Ascending order
Percentile
Houses
house
Price per m²
Houses
house
Transaction amount
Apartments
apt.
Price per m²
Apartments
apt.
Transaction amount
10th percentile
2 252 
254 K
2 643 
116 K
20th percentile
2 503 
269 K
2 746 
125 K
30th percentile
2 693 
306 K
2 806 
131 K
40th percentile
2 771 
316 K
2 961 
142 K
50th percentile
2 983 
330 K
3 131 
153 K
60th percentile
3 148 
342 K
3 228 
162 K
70th percentile
3 256 
372 K
3 293 
174 K
80th percentile
3 296 
383 K
3 419 
191 K
90th percentile
3 463 
421 K
3 549 
234 K

National and departmental comparison

Evolution of the median price per m² of houses

Evolution of the median price per m² of apartments

Quarterly evolution

Evolution of the median price per m²

Evolution of the number of transactions

Quarterly data

Descending order
Quarter
Houses
house
transactions
Houses
house
Price per m²
Apartments
apt.
transactions
Apartments
apt.
Price per m²
2025 Q2
5
3 111 
1
3 213 
2025 Q1
6
3 276 
0
--- 
2024 Q4
11
2 983 
1
2 828 
2024 Q3
5
2 625 
1
2 713 
2024 Q2
4
2 636 
0
--- 
2024 Q1
1
3 409 
1
2 754 
2023 Q4
4
2 306 
0
--- 
2023 Q3
1
3 148 
0
--- 
2023 Q2
2
3 256 
0
--- 
2023 Q1
4
3 527 
1
3 761 
2022 Q4
5
3 509 
0
--- 
2022 Q3
4
3 224 
1
3 049 
2022 Q2
6
3 320 
2
3 458 
2022 Q1
3
2 290 
1
3 250 
2021 Q4
10
2 738 
1
2 017 
2021 Q3
4
3 158 
0
--- 
2021 Q2
10
2 848 
0
--- 
2021 Q1
3
2 586 
0
--- 
2020 Q4
7
2 574 
0
--- 
2020 Q3
10
2 208 
1
2 994 
2020 Q2
3
2 449 
1
2 747 
2020 Q1
3
1 880 
1
3 008 
2019 Q4
7
2 208 
0
--- 
2019 Q3
8
1 954 
0
--- 
2019 Q2
5
2 610 
1
2 608 
2019 Q1
3
2 206 
1
3 105 
2018 Q4
1
2 584 
0
--- 
2018 Q3
5
2 421 
0
--- 
2018 Q2
6
2 508 
2
2 714 
2018 Q1
5
2 325 
0
--- 
2017 Q4
5
2 232 
0
--- 
2017 Q3
7
1 896 
0
--- 
2017 Q2
10
2 082 
0
--- 
2017 Q1
6
2 218 
1
1 964 
2016 Q4
12
2 350 
0
--- 
2016 Q3
4
2 340 
0
--- 
2016 Q2
4
2 372 
1
2 238 
2016 Q1
2
2 176 
1
2 563 
2015 Q4
7
2 305 
3
2 359 
2015 Q3
6
2 268 
3
2 484 
2015 Q2
2
2 115 
2
2 512 
2015 Q1
8
2 288 
1
2 313 
2014 Q4
12
1 968 
10
2 612 
2014 Q3
4
2 286 
4
2 512 
2014 Q2
5
2 230 
8
2 656 
2014 Q1
3
2 526 
0
--- 

Overview of the latest real estate transactions

The following list is an anonymized overview of the latest transactions. For more details and to find all transactions, please use the map to view transactions by plot or the transaction search page for a search by criteria.

2025-06-24
525 000 
Sale
Land
590 m2
-Sols
2025-06-16
170 300 
3 213  /m²(53 m²)
Sale
Apartments
Apartment
3 rooms
53 m2
1 outbuilding
2025-05-28
420 000 
3 111  /m²(135 m²)
Sale
Houses
House
5 rooms
135 m2
Land
894 m2
-Sols
2025-05-27
384 000 
2 272  /m²(169 m²)
Sale
Land
161 m2
-Sols
Houses
House
5 rooms
169 m2
Land
530 m2
-Sols
Land
13 m2
-Terrains à bâtir
2025-05-23
518 350 
3 987  /m²(130 m²)
Sale
Houses
House
5 rooms
130 m2
Land
304 m2
-Sols
Land
397 m2
-Sols
2025-05-02
111 000 
793  /m²(140 m²)
Sale
Houses
House
5 rooms
140 m2
Land
883 m2
-Sols
2025-04-30
311 000 
3 456  /m²(90 m²)
Sale
Houses
House
4 rooms
90 m2
Land
405 m2
-Terrains à bâtir
2025-03-27
310 000 
2 768  /m²(112 m²)
Sale
Houses
House
6 rooms
112 m2
Land
843 m2
-Sols
2025-03-27
377 000 
3 278  /m²(115 m²)
Sale
Houses
House
5 rooms
115 m2
Land
606 m2
-Sols
2025-03-19
653 900 
3 129  /m²(209 m²)
3 869  /m²(169 m²)
Sale
Houses
House
6 rooms
169 m2
Commercial property
40 m2
Land
382 m2
-Sols
Land
369 m2
-Jardins
2025-02-10
264 000 
3 300  /m²(80 m²)
Sale
Houses
House
4 rooms
80 m2
Land
223 m2
-Sols
2025-02-04
268 500 
3 274  /m²(82 m²)
Sale
Houses
House
2 rooms
82 m2
1 outbuilding
Land
165 m2
-Sols
Land
20 m2
-Sols
Land
63 m2
-Sols
Land
48 m2
-Jardins
2025-01-31
271 000 
3 474  /m²(78 m²)
Sale
Houses
House
4 rooms
78 m2
Land
787 m2
-Sols
2025-01-21
1 
Sale
Land
8 m2
-Sols
2025-01-06
323 950 
2 769  /m²(117 m²)
Sale
Houses
House
5 rooms
117 m2
Land
657 m2
-Sols
2024-12-30
338 150 
3 251  /m²(104 m²)
Sale
Houses
House
3 rooms
104 m2
Land
203 m2
-Sols
Land
20 m2
-Sols
Land
63 m2
-Sols
Land
72 m2
-Jardins
2024-12-30
181 000 
2 828  /m²(64 m²)
Sale
Apartments
Apartment
3 rooms
64 m2
1 outbuilding
2024-12-30
15 000 
536  /m²(28 m²)
Sale
Commercial property
28 m2
2024-12-17
373 000 
3 108  /m²(120 m²)
Sale
Houses
House
7 rooms
120 m2
Land
568 m2
-Sols
Land
7088 m2
-Sols
Land
25 m2
-Sols
2024-12-06
344 500 
2 515  /m²(137 m²)
Sale
Houses
House
5 rooms
137 m2
Land
505 m2
-Sols
Land
185 m2
-Jardins
485 transactions listed in the municipality

Calvados (14)

Most expensive cities

City
name
Descending orderHouses
house
Price per m²
6 297 
5 823 
5 346 
5 102 
5 042 
5 040 
4 875 
City
name
Descending orderApartments
apt.
Price per m²
6 532 
6 000 
5 056 
4 667 
4 332 
4 307 
4 287 

Least expensive cities

City
name
Ascending orderHouses
house
Price per m²
643 
948 
960 
968 
City
name
Ascending orderApartments
apt.
Price per m²
407 
545 
556