Real estate price map
Real estate price map in the municipality of Condé-en-Normandie, choose a section to see transactions by parcel.
Price per m² in Condé-en-Normandie
Median price of real estate
in the municipality of Condé-en-Normandie
1 537 € /m²
1 168 € /m²
1 454 € /m²
1453 transactions listed in the municipality
Yearly data
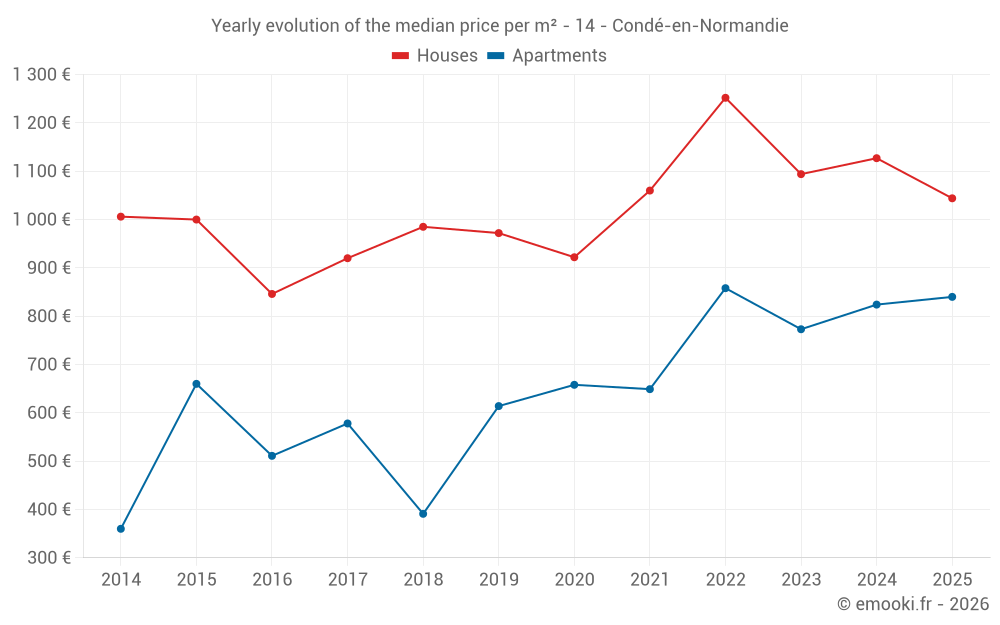
Yearly evolution of the median price per m²
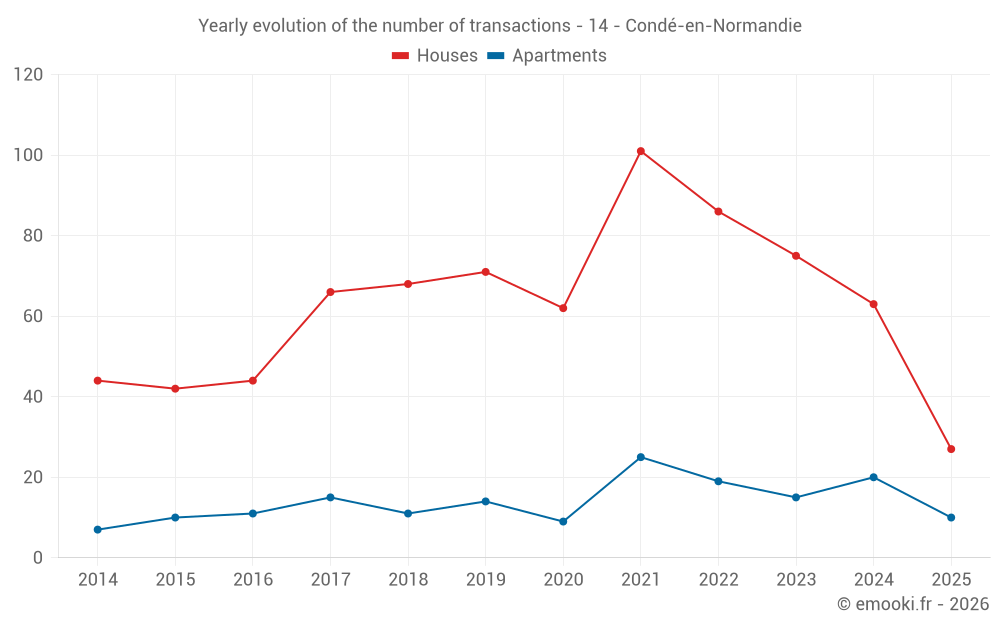
Yearly evolution of the number of transactions
Warning, last year incomplete. Projections made based on the proportions between semesters of the previous year at the departmental/national level and by type of property.
Yearly table
transactions
Price per m²
transactions
Price per m²
Analysis
Structure of prices per m²
Values of price percentiles per m² over the periods used for the estimated price of each type of property.
Structure of transaction amounts
Values of transaction amounts percentiles over the periods used for the estimated price of each type of property.
Transaction amounts and prices per m² by percentile
Price per m²
Transaction amount
Price per m²
Transaction amount
National and departmental comparison
Evolution of the median price per m² of houses
Evolution of the median price per m² of apartments
Quarterly data
Quarterly evolution of the median price per m²
Quarterly evolution of the number of transactions
Quarterly table
transactions
Price per m²
transactions
Price per m²
Key takeaways
What is the price per m2 of houses in Condé-en-Normandie?
The median price on the 27 house transactions of the last 6 months in the municipality of Condé-en-Normandie was 1 044 € per square meter for a median property value of 100 000 €. Over this period, 60% of transactions were between 602 and 1 537 € per square meter (from the 2nd to the 8th deciles).
What is the price per m2 of apartments in Condé-en-Normandie?
The median price on the 20 apartment transactions of the last 12 months in the municipality of Condé-en-Normandie was 854 € per square meter for a median property value of 55 540 €. Over this period, 60% of transactions were between 718 and 1 168 € per square meter (from the 2nd to the 8th deciles).
Compare with neighboring municipalities
name
Price per m²
Price per m²
City information
Zip codes
- CONDE SUR NOIREAU 14110 CONDE EN NORMANDIE
- PROUSSY 14110 CONDE EN NORMANDIE
- ST GERMAIN DU CRIOULT 14110 CONDE EN NORMANDIE
- LA CHAPELLE ENGERBOLD 14770 CONDE EN NORMANDIE
- LENAULT 14770 CONDE EN NORMANDIE
- ST PIERRE LA VIEILLE 14770 CONDE EN NORMANDIE