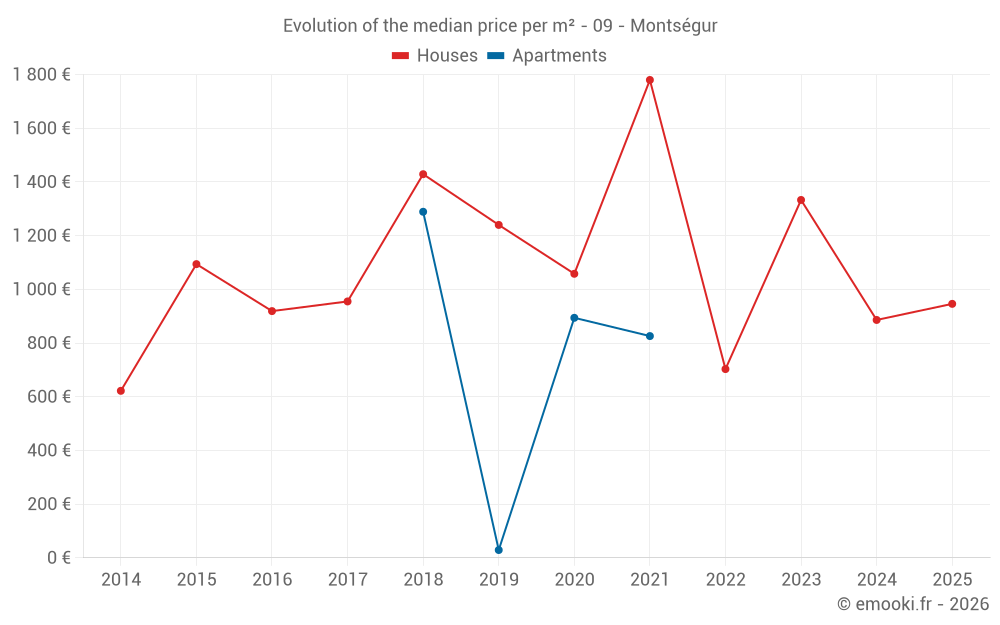
Median price of real estate
in the municipality of Montségur
Houses
918 € /m²
Reliability 6/10
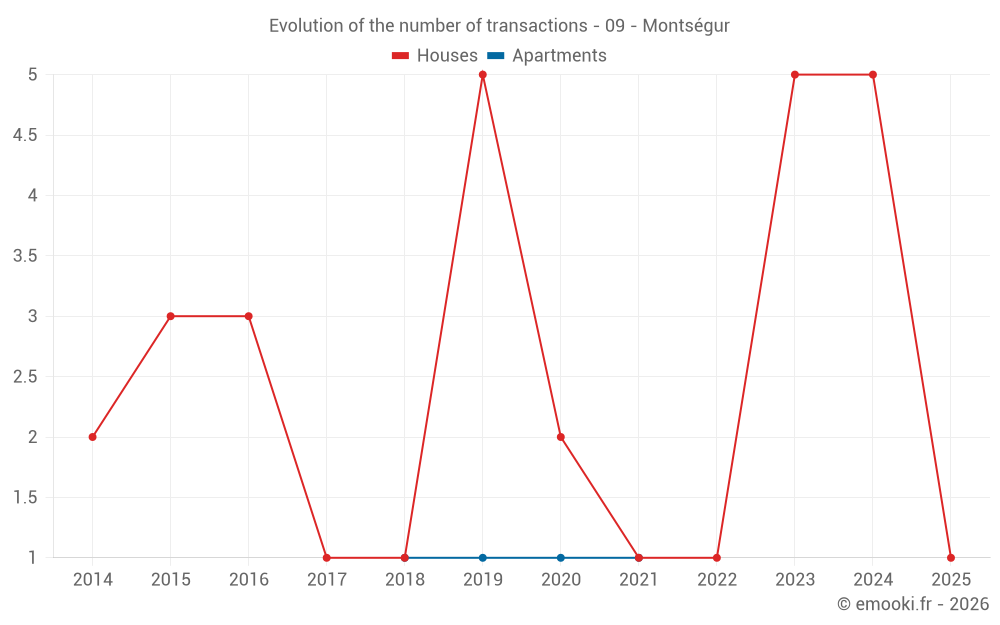
Median price on the 12 transactions of the last 36 months.
from 737 to
1 467 € /m²
1 467 € /m²
60% of transactions from the 2nd to the 8th deciles.
Apartments
860 € /m²
Reliability 2/10
Median price on the 4 transactions of the last 96 months.
Dwellings
918 € /m²
Reliability 6/10
Median price on the 12 transactions of the last 36 months.
from 737 to
1 467 € /m²
1 467 € /m²
60% of transactions from the 2nd to the 8th deciles.