emooki
HomePrice mapTransactions
🇬🇧 English🇫🇷 Français🇩🇪 Deutsch🇪🇸 Español🇮🇹 Italiano

Real estate price map


Real estate price map in the Ariège department.

Department 09
Ariège

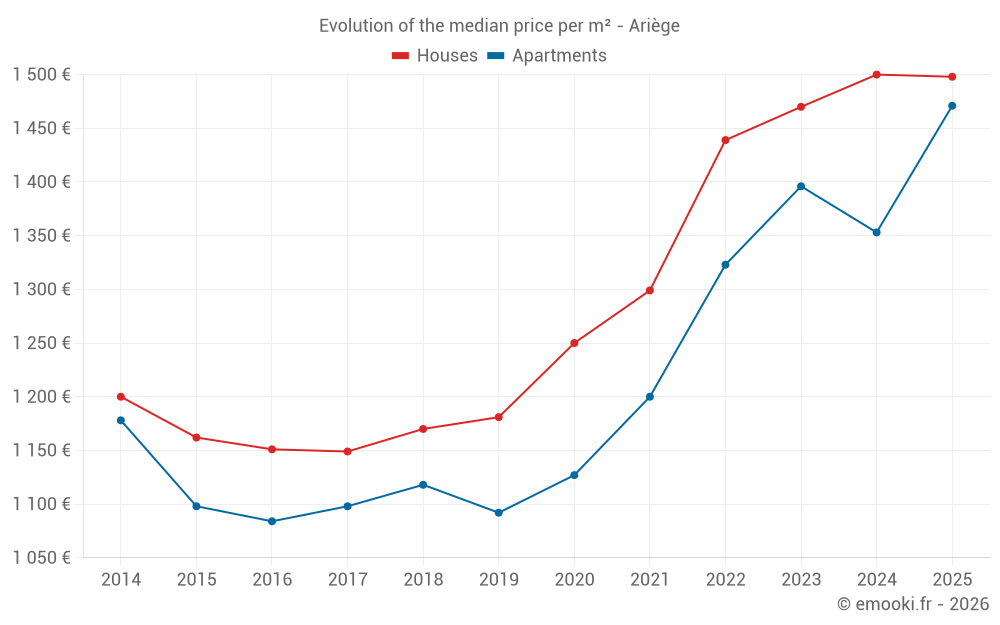
Median price of real estate
in the Ariège department

HousesHouses
1 498  /m²
1-23-45-67-89-10
Reliability 9/10
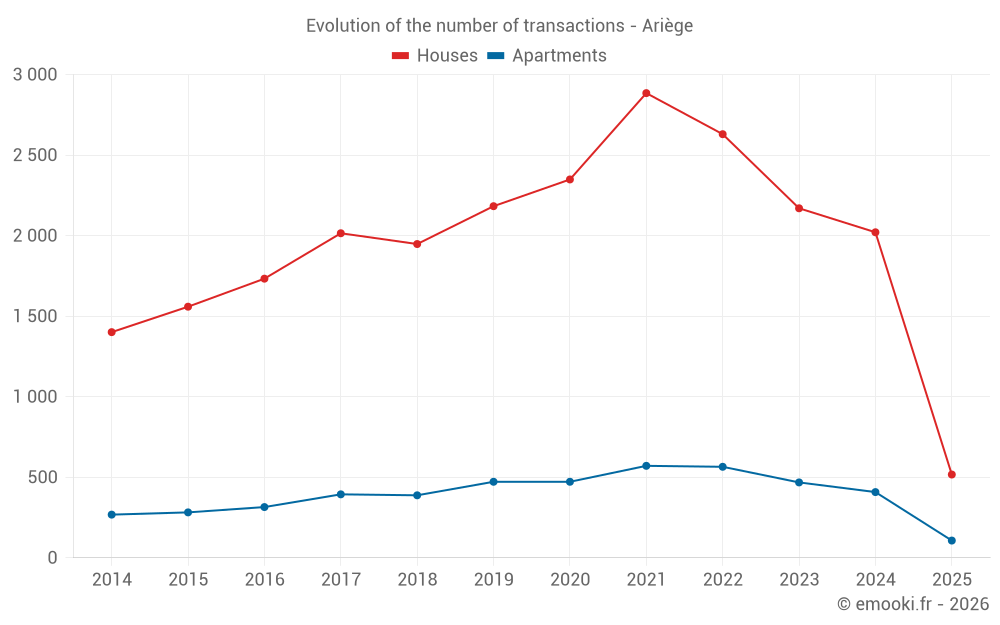
Median price on the 517 transactions of the last 6 months.
from 800 to
2 156  /m²
60% of transactions from the 2nd to the 8th deciles.
ApartmentsApartments
1 471  /m²
1-23-45-67-89-10
Reliability 9/10
Median price on the 107 transactions of the last 6 months.
from 972 to
2 013  /m²
60% of transactions from the 2nd to the 8th deciles.
DwellingsDwellings
1 488  /m²
1-23-45-67-89-10
Reliability 9/10
Median price on the 624 transactions of the last 6 months.
from 814 to
2 143  /m²
60% of transactions from the 2nd to the 8th deciles.
HousesEvolution of the price per m² of houses since...
1 year
-0.1%
2 years
+1.9%
3 years
+4.1%
4 years
+15%
5 years
+20%
6 years
+27%
7 years
+28%
8 years
+30%
9 years
+30%
10 years
+29%
11 years
+25%
ApartmentsEvolution of the price per m² of apartments since...
1 year
+8.7%
2 years
+5.4%
3 years
+11%
4 years
+23%
5 years
+31%
6 years
+35%
7 years
+32%
8 years
+34%
9 years
+36%
10 years
+34%
11 years
+25%

Yearly evolution

Evolution of the median price per m²

Evolution of the number of transactions

Warning, last year incomplete. Projections made based on the proportions between semesters of the previous year at the departmental/national level and by type of property.

Yearly data

Descending order
Year
Houses
house
transactions
Houses
house
Price per m²
Apartments
apt.
transactions
Apartments
apt.
Price per m²
2025
517
1 498 
107
1 471 
2024
2 021
1 500 
408
1 353 
2023
2 170
1 470 
468
1 396 
2022
2 630
1 439 
565
1 323 
2021
2 885
1 299 
571
1 200 
2020
2 349
1 250 
472
1 127 
2019
2 183
1 181 
472
1 092 
2018
1 948
1 170 
388
1 118 
2017
2 015
1 149 
394
1 098 
2016
1 733
1 151 
315
1 084 
2015
1 559
1 162 
282
1 098 
2014
1 401
1 200 
268
1 178 

Analysis

Structure of prices per m²

Values of price percentiles per m² over the periods used for the estimated price of each type of property.

Structure of transaction amounts

Values of transaction amounts percentiles over the periods used for the estimated price of each type of property.

Transaction amounts and prices per m² by percentile

Ascending order
Percentile
Houses
house
Price per m²
Houses
house
Transaction amount
Apartments
apt.
Price per m²
Apartments
apt.
Transaction amount
10th percentile
539 
38 000 
573 
44 300 
20th percentile
800 
60 000 
972 
55 860 
30th percentile
1 025 
85 000 
1 094 
63 440 
40th percentile
1 261 
110 K
1 264 
69 020 
50th percentile
1 498 
125 K
1 471 
76 000 
60th percentile
1 699 
145 K
1 675 
83 000 
70th percentile
1 880 
166 K
1 818 
104 K
80th percentile
2 156 
202 K
2 013 
118 K
90th percentile
2 474 
243 K
2 638 
153 K

Quarterly evolution

Evolution of the median price per m²

Evolution of the number of transactions

Quarterly data

Descending order
Quarter
Houses
house
transactions
Houses
house
Price per m²
Apartments
apt.
transactions
Apartments
apt.
Price per m²
2025 Q2
61
1 598 
23
1 742 
2025 Q1
456
1 468 
84
1 313 
2024 Q4
608
1 528 
116
1 353 
2024 Q3
507
1 524 
109
1 375 
2024 Q2
485
1 470 
99
1 395 
2024 Q1
421
1 466 
84
1 210 
2023 Q4
534
1 478 
106
1 354 
2023 Q3
529
1 420 
102
1 466 
2023 Q2
547
1 508 
127
1 412 
2023 Q1
560
1 430 
133
1 253 
2022 Q4
639
1 549 
150
1 261 
2022 Q3
682
1 491 
132
1 320 
2022 Q2
705
1 415 
143
1 316 
2022 Q1
604
1 333 
140
1 379 
2021 Q4
737
1 354 
140
1 158 
2021 Q3
795
1 301 
154
1 318 
2021 Q2
702
1 272 
148
1 238 
2021 Q1
651
1 255 
129
1 102 
2020 Q4
772
1 304 
140
1 110 
2020 Q3
598
1 252 
113
1 141 
2020 Q2
467
1 239 
101
1 208 
2020 Q1
512
1 196 
118
1 072 
2019 Q4
588
1 169 
129
1 081 
2019 Q3
579
1 214 
121
1 026 
2019 Q2
520
1 172 
124
1 078 
2019 Q1
496
1 168 
98
1 200 
2018 Q4
549
1 168 
105
1 119 
2018 Q3
516
1 240 
99
1 171 
2018 Q2
449
1 176 
89
1 050 
2018 Q1
434
1 090 
95
1 121 
2017 Q4
527
1 150 
125
1 066 
2017 Q3
520
1 156 
97
1 082 
2017 Q2
489
1 100 
83
1 183 
2017 Q1
479
1 181 
89
1 089 
2016 Q4
434
1 170 
101
1 138 
2016 Q3
524
1 169 
67
1 224 
2016 Q2
405
1 111 
69
1 016 
2016 Q1
370
1 154 
78
966 
2015 Q4
439
1 133 
78
1 212 
2015 Q3
421
1 220 
83
1 024 
2015 Q2
361
1 143 
70
1 000 
2015 Q1
338
1 156 
51
1 103 
2014 Q4
355
1 270 
69
1 216 
2014 Q3
373
1 189 
74
1 212 
2014 Q2
338
1 149 
66
1 144 
2014 Q1
335
1 215 
59
1 000 

Ariège (09)

Most expensive cities

City
name
Descending orderHouses
house
Price per m²
3 212 
2 611 
2 560 
2 454 
2 324 
2 295 
2 203 
2 192 
2 138 
City
name
Descending orderApartments
apt.
Price per m²
2 632 
2 500 
2 488 
1 814 
1 798 
1 669 

Least expensive cities

City
name
Ascending orderHouses
house
Price per m²
385 
534 
551 
567 
573 
652 
City
name
Ascending orderApartments
apt.
Price per m²
199 
250 
254 
294 
340 
359 
359