emooki
HomePrice mapTransactions
🇬🇧 English🇫🇷 Français🇩🇪 Deutsch🇪🇸 Español🇮🇹 Italiano

Real estate price map


Real estate price map in the municipality of Veynes, choose a section to see transactions by parcel.

Hautes-Alpes (05)

Veynes - Real estate price m²

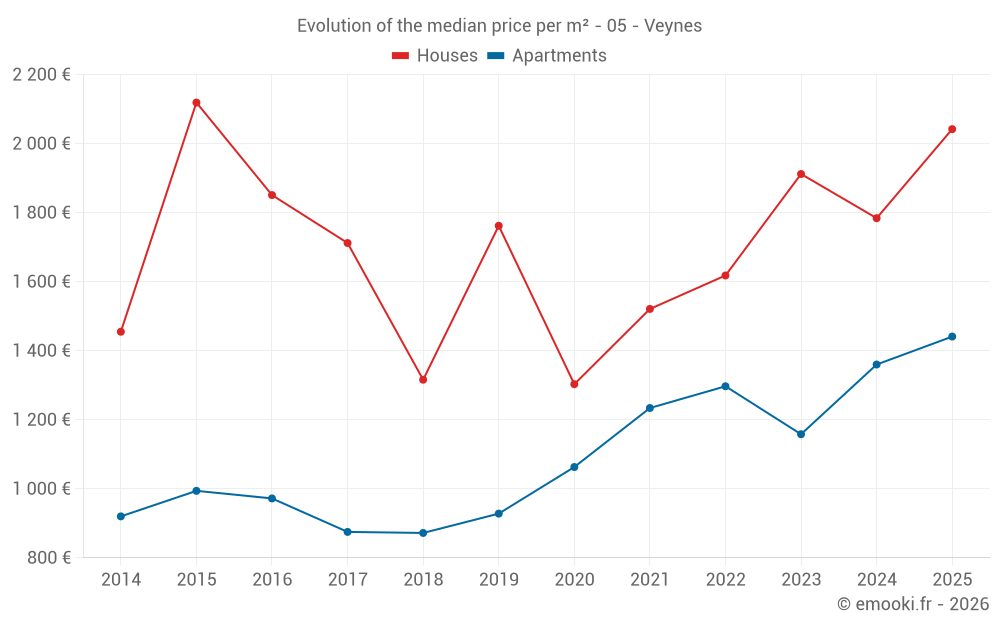
Median price of real estate
in the municipality of Veynes

HousesHouses
1 897  /m²
1-23-45-67-89-10
Reliability 8/10
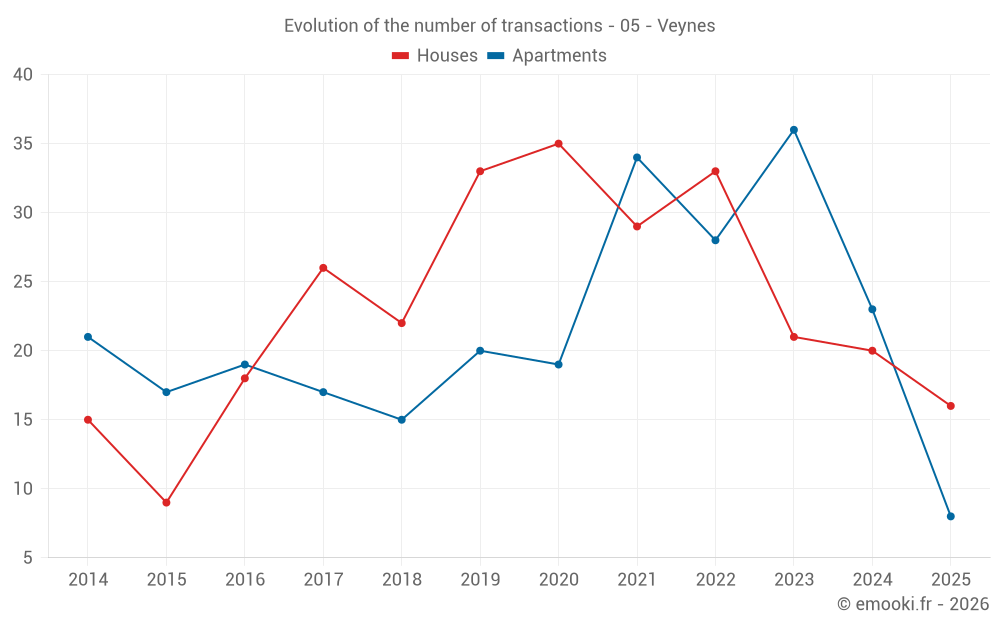
Median price on the 31 transactions of the last 12 months.
from 1 588 to
2 778  /m²
60% of transactions from the 2nd to the 8th deciles.
ApartmentsApartments
1 438  /m²
1-23-45-67-89-10
Reliability 8/10
Median price on the 21 transactions of the last 12 months.
from 1 134 to
1 944  /m²
60% of transactions from the 2nd to the 8th deciles.
DwellingsDwellings
1 924  /m²
1-23-45-67-89-10
Reliability 9/10
Median price on the 24 transactions of the last 6 months.
from 1 442 to
2 624  /m²
60% of transactions from the 2nd to the 8th deciles.
HousesEvolution of the price per m² of houses since...
1 year
+14%
2 years
+6.8%
3 years
+26%
4 years
+34%
5 years
+57%
6 years
+16%
7 years
+55%
8 years
+19%
9 years
+10%
10 years
-3.6%
11 years
+40%
The price per m² of houses has increased by 57% since 5 years, but it has decreased by 3.6% in 10 years.
ApartmentsEvolution of the price per m² of apartments since...
1 year
+6%
2 years
+24%
3 years
+11%
4 years
+17%
5 years
+36%
6 years
+55%
7 years
+65%
8 years
+65%
9 years
+48%
10 years
+45%
11 years
+57%

Yearly evolution

Evolution of the median price per m²

Evolution of the median price per m² - 05 - Veynes

Evolution of the number of transactions

Warning, last year incomplete. Projections made based on the proportions between semesters of the previous year at the departmental/national level and by type of property.

Evolution of the number of transactions - 05 - Veynes

Yearly data

Descending order
Year
Houses
house
transactions
Houses
house
Price per m²
Apartments
apt.
transactions
Apartments
apt.
Price per m²
2025
16
2 042 
8
1 441 
2024
20
1 784 
23
1 360 
2023
21
1 912 
36
1 158 
2022
33
1 618 
28
1 297 
2021
29
1 521 
34
1 234 
2020
35
1 303 
19
1 063 
2019
33
1 762 
20
928 
2018
22
1 316 
15
872 
2017
26
1 712 
17
875 
2016
18
1 851 
19
972 
2015
9
2 119 
17
994 
2014
15
1 455 
21
920 

Analysis

Structure of prices per m²

Values of price percentiles per m² over the periods used for the estimated price of each type of property.

Structure of transaction amounts

Values of transaction amounts percentiles over the periods used for the estimated price of each type of property.

Transaction amounts and prices per m² by percentile

Ascending order
Percentile
Houses
house
Price per m²
Houses
house
Transaction amount
Apartments
apt.
Price per m²
Apartments
apt.
Transaction amount
10th percentile
1 110 
86 800 
909 
62 000 
20th percentile
1 588 
94 400 
1 134 
68 000 
30th percentile
1 736 
129 K
1 200 
80 750 
40th percentile
1 781 
161 K
1 250 
87 400 
50th percentile
1 897 
188 K
1 438 
105 K
60th percentile
1 966 
200 K
1 481 
106 K
70th percentile
2 219 
238 K
1 694 
138 K
80th percentile
2 778 
247 K
1 944 
150 K
90th percentile
2 857 
258 K
2 522 
166 K

National and departmental comparison

Evolution of the median price per m² of houses

Evolution of the median price per m² of apartments

Quarterly evolution

Evolution of the median price per m²

Evolution of the number of transactions

Quarterly data

Descending order
Quarter
Houses
house
transactions
Houses
house
Price per m²
Apartments
apt.
transactions
Apartments
apt.
Price per m²
2025 Q2
8
2 268 
4
1 384 
2025 Q1
8
1 800 
4
1 722 
2024 Q4
7
1 716 
8
1 366 
2024 Q3
8
1 874 
5
1 191 
2024 Q2
3
2 253 
8
1 372 
2024 Q1
2
2 856 
2
914 
2023 Q4
2
1 214 
6
1 036 
2023 Q3
6
3 000 
10
1 391 
2023 Q2
2
2 147 
6
1 124 
2023 Q1
11
1 688 
14
1 032 
2022 Q4
8
1 720 
4
1 376 
2022 Q3
10
1 425 
12
1 192 
2022 Q2
6
1 261 
3
1 956 
2022 Q1
9
1 618 
9
1 308 
2021 Q4
4
1 152 
13
1 310 
2021 Q3
8
1 305 
11
1 147 
2021 Q2
8
1 926 
4
1 074 
2021 Q1
9
2 255 
6
1 034 
2020 Q4
14
1 287 
4
864 
2020 Q3
10
1 544 
7
1 029 
2020 Q2
5
1 735 
2
1 324 
2020 Q1
6
1 208 
6
1 198 
2019 Q4
5
1 652 
5
1 165 
2019 Q3
12
1 710 
5
1 114 
2019 Q2
8
1 850 
8
902 
2019 Q1
8
1 771 
2
726 
2018 Q4
6
636 
6
1 050 
2018 Q3
3
1 424 
6
623 
2018 Q2
4
2 004 
3
971 
2018 Q1
9
1 165 
0
--- 
2017 Q4
8
1 697 
6
884 
2017 Q3
5
1 300 
5
768 
2017 Q2
7
1 686 
2
920 
2017 Q1
6
1 740 
4
950 
2016 Q4
5
1 613 
3
1 060 
2016 Q3
7
1 907 
5
612 
2016 Q2
4
1 851 
3
923 
2016 Q1
2
1 353 
8
1 001 
2015 Q4
2
1 961 
1
833 
2015 Q3
3
2 119 
7
1 031 
2015 Q2
1
2 516 
7
877 
2015 Q1
3
1 340 
2
1 256 
2014 Q4
5
2 080 
9
810 
2014 Q3
6
1 330 
5
1 005 
2014 Q1
4
1 111 
7
1 224 

Overview of the latest real estate transactions

The following list is an anonymized overview of the latest transactions. For more details and to find all transactions, please use the map to view transactions by plot or the transaction search page for a search by criteria.

2025-06-30
258 000 
2 932  /m²(88 m²)
Sale
Houses
House
4 rooms
88 m2
Land
655 m2
-Sols
2025-06-24
313 060 
1 897  /m²(165 m²)
Sale
Houses
House
8 rooms
165 m2
Land
873 m2
-Sols
Land
322 m2
-Terres
2025-06-19
12 025 
Sale
Land
650 m2
-Sols
2025-06-11
271 500 
2 828  /m²(96 m²)
Sale
Houses
House
4 rooms
96 m2
Land
1384 m2
-Sols
Land
707 m2
-Sols
2025-05-28
13 000 
Sale
1 outbuilding
2025-05-28
221 750 
2 132  /m²(104 m²)
Sale
Houses
House
4 rooms
104 m2
Land
538 m2
-Sols
Land
10 m2
-Sols
2025-05-21
116 000 
2 522  /m²(46 m²)
Sale
Apartments
Apartment
2 rooms
46 m2
1 outbuilding
2025-05-15
3 000 
Sale
Land
1231 m2
-Terres
2025-05-05
199 000 
1 951  /m²(102 m²)
Sale
Houses
House
5 rooms
102 m2
Land
411 m2
-Sols
Land
9 m2
-Sols
2025-04-30
255 000 
2 833  /m²(90 m²)
Sale
Houses
House
3 rooms
90 m2
2 outbuildings
Land
403 m2
-Sols
Land
3494 m2
-Terres
Land
1645 m2
-Terres
Land
1260 m2
-Terres
2025-04-29
105 910 
1 324  /m²(80 m²)
Sale
Apartments
Apartment
4 rooms
80 m2
2 outbuildings
2025-04-25
185 000 
2 403  /m²(77 m²)
Sale
Houses
House
4 rooms
77 m2
1 outbuilding
Land
1235 m2
-Prés
Land
265 m2
-Prés
Land
733 m2
-Prés
Land
25 m2
-Prés
Land
17 m2
-Landes
2025-04-25
68 000 
1 015  /m²(67 m²)
Sale
Apartments
Apartment
3 rooms
67 m2
1 outbuilding
2025-04-23
199 500 
1 781  /m²(112 m²)
Sale
Houses
House
4 rooms
112 m2
1 outbuilding
Land
1142 m2
-Sols
Land
170 m2
-Terrains à bâtir
2025-04-23
1 905 550 
11 763  /m²(162 m²)
16 570  /m²(115 m²)
Sale
Apartments
Apartment
3 rooms
75 m2
Apartments
Apartment
2 rooms
40 m2
Commercial property
47 m2
2 outbuildings
Land
91 m2
-Sols
2025-04-16
7 000 
Sale
Land
8020 m2
-Terres
2025-04-02
65 000 
1 444  /m²(45 m²)
Sale
Apartments
Apartment
2 rooms
45 m2
2025-03-27
93 000 
1 824  /m²(51 m²)
Sale
Houses
House
2 rooms
51 m2
Land
48 m2
-Sols
2025-03-25
32 000 
Sale
Land
234 m2
-Sols
1 outbuilding
Land
290 m2
-Jardins
Land
50 m2
-Sols
2025-03-17
31 340 
Sale
Land
262 m2
-Landes
Land
3156 m2
-Terres
Land
228 m2
-Landes
Land
347 m2
-Terres
Land
3068 m2
-Terres
Land
1122 m2
-Landes
Land
2512 m2
-Futaies résineuses
Land
3300 m2
-Prés
Land
15880 m2
-Terres
Land
2860 m2
-Landes
Land
7280 m2
-Terres
Land
1520 m2
-Futaies résineuses
Land
1052 m2
-Prés
Land
932 m2
-Landes
Land
13603 m2
-Terres
Land
1632 m2
-Taillis simples
Land
3115 m2
-Terres
Land
1517 m2
-Taillis simples
822 transactions listed in the municipality

Hautes-Alpes (05)

Most expensive cities

City
name
Descending orderHouses
house
Price per m²
4 574 
4 505 
4 500 
4 459 
4 343 
4 213 
City
name
Descending orderApartments
apt.
Price per m²
4 259 
4 240 
3 690 
3 688 
3 650 
3 624 
3 429 
3 368 

Least expensive cities

City
name
Ascending orderHouses
house
Price per m²
614 
839 
861 
962 
1 052 
1 070 
1 074 
City
name
Ascending orderApartments
apt.
Price per m²
36 
271 
405 
463 
496 
644 
682 
700