emooki
HomePrice mapTransactions
🇬🇧 English🇫🇷 Français🇩🇪 Deutsch🇪🇸 Español🇮🇹 Italiano

Real estate price map


Real estate price map in the municipality of Montgenèvre.

Hautes-Alpes (05)
Montgenèvre

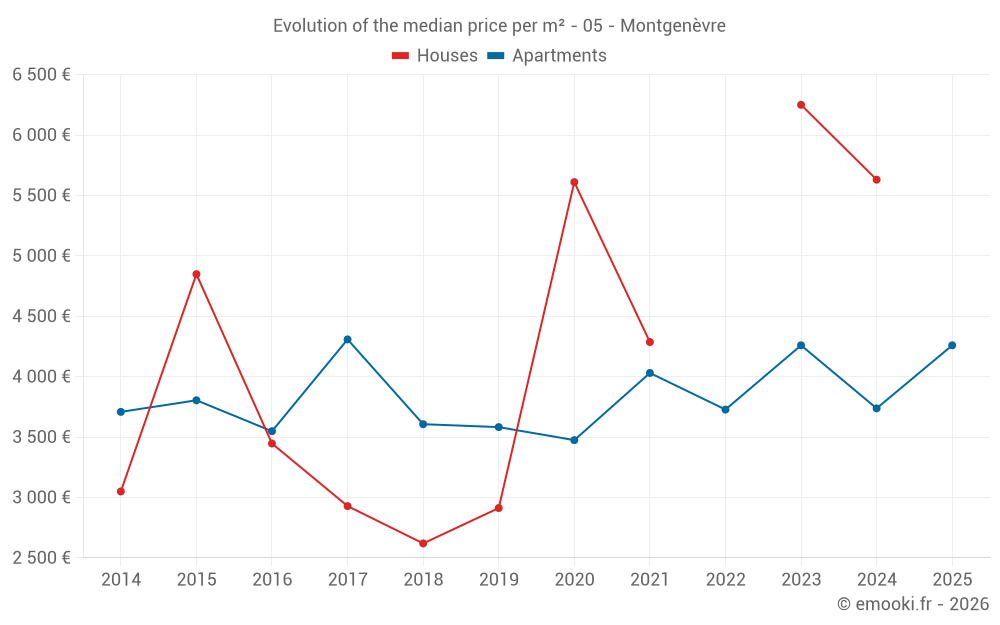
Median price of real estate
in the municipality of Montgenèvre

HousesHouses
4 574  /m²
1-23-45-67-89-10
Reliability 5/10
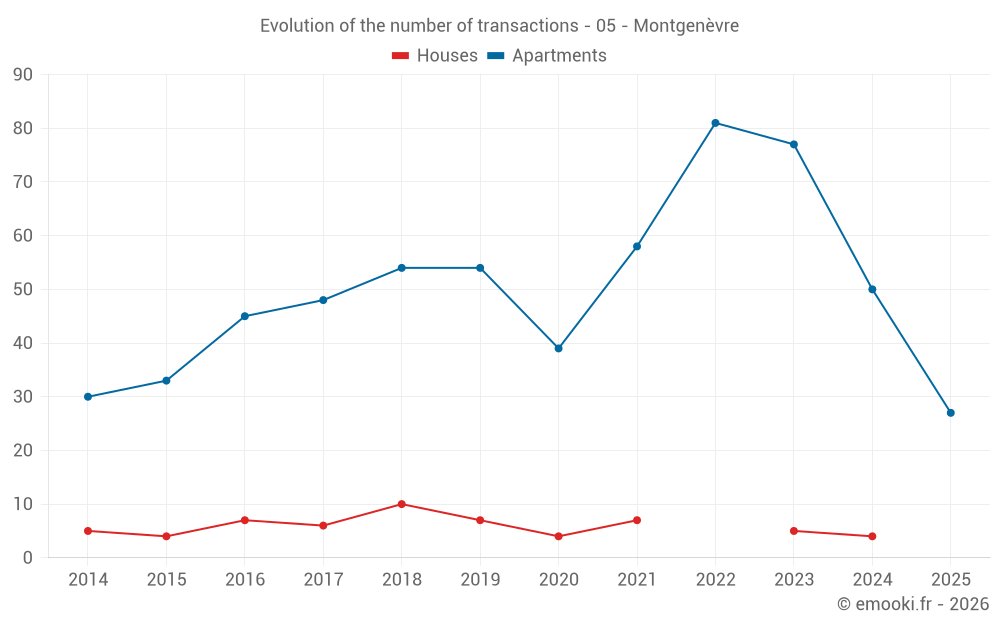
Median price on the 14 transactions of the last 48 months.
from 3 947 to
7 110  /m²
60% of transactions from the 2nd to the 8th deciles.
ApartmentsApartments
4 259  /m²
1-23-45-67-89-10
Reliability 9/10
Median price on the 27 transactions of the last 6 months.
from 3 410 to
6 266  /m²
60% of transactions from the 2nd to the 8th deciles.
DwellingsDwellings
4 259  /m²
1-23-45-67-89-10
Reliability 9/10
Median price on the 27 transactions of the last 6 months.
from 3 410 to
6 266  /m²
60% of transactions from the 2nd to the 8th deciles.
HousesEvolution of the price per m² of houses since...
1 year
--
2 years
--
3 years
--
4 years
--
5 years
--
6 years
--
7 years
--
8 years
--
9 years
--
10 years
--
11 years
--
ApartmentsEvolution of the price per m² of apartments since...
1 year
+14%
2 years
0%
3 years
+14%
4 years
+5.7%
5 years
+23%
6 years
+19%
7 years
+18%
8 years
-1.1%
9 years
+20%
10 years
+12%
11 years
+15%

Yearly evolution

Evolution of the median price per m²

Evolution of the number of transactions

Warning, last year incomplete. Projections made based on the proportions between semesters of the previous year at the departmental/national level and by type of property.

Yearly data

Descending order
Year
Houses
house
transactions
Houses
house
Price per m²
Apartments
apt.
transactions
Apartments
apt.
Price per m²
2025
0
--- 
27
4 259 
2024
4
5 630 
50
3 737 
2023
5
6 250 
77
4 259 
2022
0
--- 
81
3 727 
2021
7
4 286 
58
4 030 
2020
4
5 610 
39
3 474 
2019
7
2 912 
54
3 582 
2018
10
2 619 
54
3 606 
2017
6
2 928 
48
4 308 
2016
7
3 446 
45
3 548 
2015
4
4 848 
33
3 804 
2014
5
3 049 
30
3 708 

Analysis

Structure of prices per m²

Values of price percentiles per m² over the periods used for the estimated price of each type of property.

Structure of transaction amounts

Values of transaction amounts percentiles over the periods used for the estimated price of each type of property.

Transaction amounts and prices per m² by percentile

Ascending order
Percentile
Houses
house
Price per m²
Houses
house
Transaction amount
Apartments
apt.
Price per m²
Apartments
apt.
Transaction amount
10th percentile
2 174 
149 K
2 636 
93 200 
20th percentile
3 947 
185 K
3 410 
122 K
30th percentile
4 275 
343 K
3 620 
144 K
40th percentile
4 335 
409 K
3 850 
175 K
50th percentile
4 574 
658 K
4 259 
193 K
60th percentile
5 297 
826 K
4 738 
200 K
70th percentile
5 854 
902 K
5 451 
271 K
80th percentile
7 110 
939 K
6 266 
289 K
90th percentile
8 606 
990 K
7 031 
329 K

National and departmental comparison

Evolution of the median price per m² of houses

Evolution of the median price per m² of apartments

Quarterly evolution

Evolution of the median price per m²

Evolution of the number of transactions

Quarterly data

Descending order
Quarter
Houses
house
transactions
Houses
house
Price per m²
Apartments
apt.
transactions
Apartments
apt.
Price per m²
2025 Q2
0
--- 
16
4 270 
2025 Q1
0
--- 
11
4 000 
2024 Q4
2
3 555 
19
3 700 
2024 Q3
1
5 450 
10
3 578 
2024 Q2
1
8 694 
16
3 796 
2024 Q1
0
--- 
5
4 463 
2023 Q4
2
4 574 
24
4 784 
2023 Q3
1
6 250 
14
4 524 
2023 Q2
1
14 410 
26
4 272 
2023 Q1
1
8 400 
13
3 308 
2022 Q4
0
--- 
16
4 128 
2022 Q3
0
--- 
14
3 459 
2022 Q2
0
--- 
33
3 731 
2022 Q1
0
--- 
18
3 695 
2021 Q4
3
3 600 
17
4 652 
2021 Q3
2
4 294 
11
3 513 
2021 Q2
2
5 864 
18
3 460 
2021 Q1
0
--- 
12
4 230 
2020 Q4
2
7 392 
20
3 838 
2020 Q3
2
3 949 
3
2 750 
2020 Q2
0
--- 
9
2 816 
2020 Q1
0
--- 
7
3 407 
2019 Q4
5
2 727 
17
3 190 
2019 Q3
2
5 306 
12
3 995 
2019 Q2
0
--- 
18
3 582 
2019 Q1
0
--- 
7
4 890 
2018 Q4
4
3 827 
19
3 854 
2018 Q3
3
2 688 
8
4 112 
2018 Q2
2
1 686 
12
2 880 
2018 Q1
1
2 305 
15
3 674 
2017 Q4
2
4 176 
15
4 429 
2017 Q3
2
2 896 
13
3 382 
2017 Q2
1
5 534 
10
4 490 
2017 Q1
1
2 249 
10
4 464 
2016 Q4
4
3 382 
14
3 808 
2016 Q3
1
3 446 
7
3 386 
2016 Q2
2
2 840 
16
3 802 
2016 Q1
0
--- 
8
2 922 
2015 Q4
0
--- 
10
3 856 
2015 Q3
0
--- 
9
3 150 
2015 Q2
2
3 896 
11
4 059 
2015 Q1
2
4 848 
3
3 514 
2014 Q4
2
3 430 
9
3 108 
2014 Q3
3
3 000 
4
3 286 
2014 Q2
0
--- 
7
3 390 
2014 Q1
0
--- 
10
3 981 

Hautes-Alpes (05)

Most expensive cities

City
name
Descending orderHouses
house
Price per m²
4 574 
4 505 
4 500 
4 459 
4 343 
4 213 
City
name
Descending orderApartments
apt.
Price per m²
4 259 
4 240 
3 690 
3 688 
3 650 
3 624 
3 429 
3 368 

Least expensive cities

City
name
Ascending orderHouses
house
Price per m²
614 
839 
861 
962 
1 052 
1 070 
1 074 
City
name
Ascending orderApartments
apt.
Price per m²
36 
271 
405 
463 
496 
644 
682 
700