emooki
HomePrice mapTransactions
🇬🇧 English🇫🇷 Français🇩🇪 Deutsch🇪🇸 Español🇮🇹 Italiano

Real estate price map


Real estate price map in the municipality of Serres, choose a section to see transactions by parcel.

Hautes-Alpes (05)

Serres - Real estate price m²

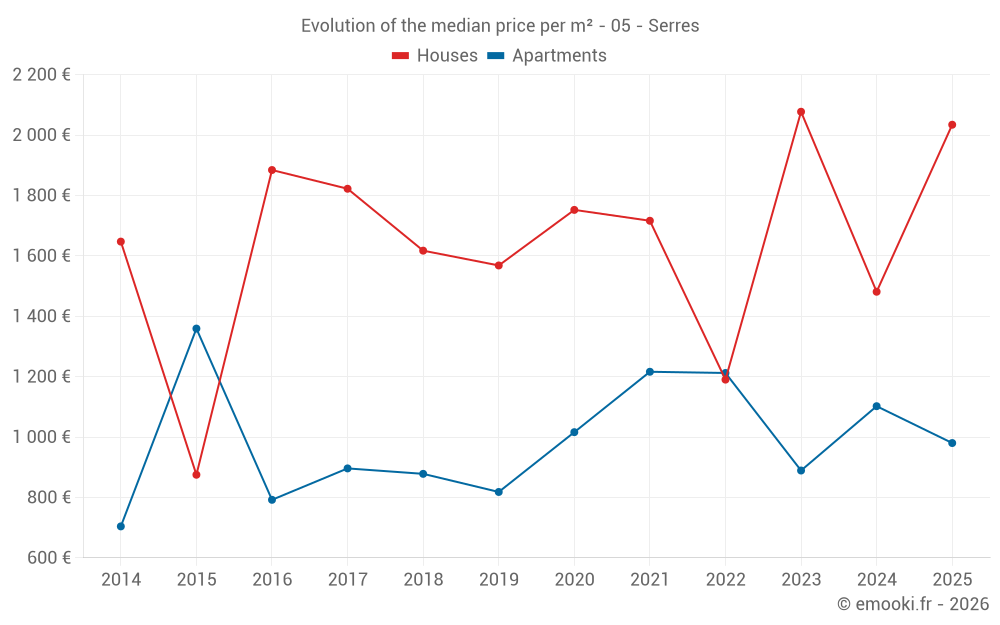
Median price of real estate
in the municipality of Serres

HousesHouses
1 970  /m²
1-23-45-67-89-10
Reliability 8/10
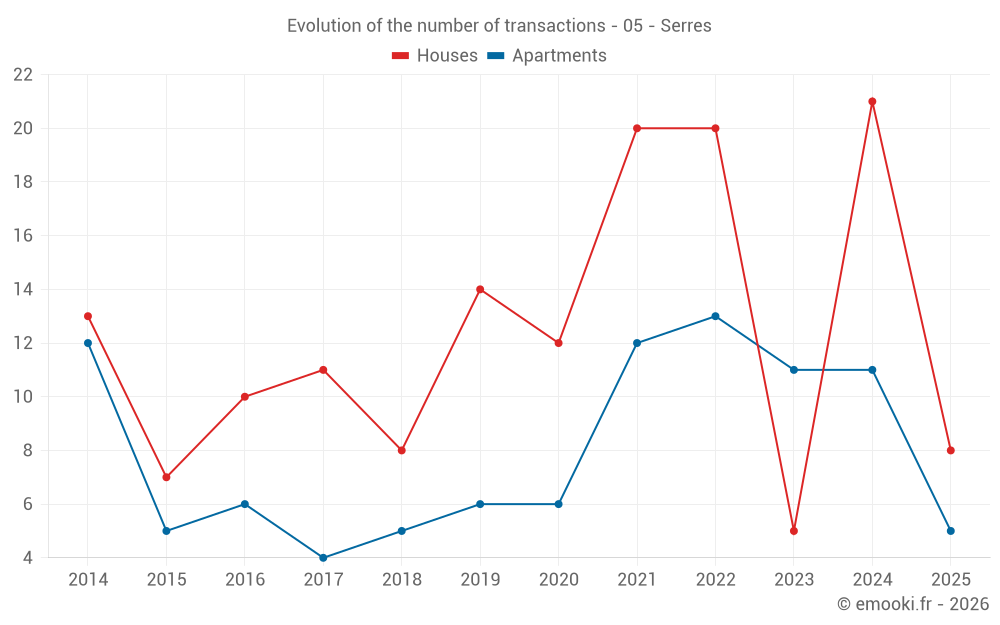
Median price on the 18 transactions of the last 12 months.
from 1 511 to
2 406  /m²
60% of transactions from the 2nd to the 8th deciles.
ApartmentsApartments
970  /m²
1-23-45-67-89-10
Reliability 7/10
Median price on the 22 transactions of the last 24 months.
from 782 to
1 478  /m²
60% of transactions from the 2nd to the 8th deciles.
DwellingsDwellings
1 622  /m²
1-23-45-67-89-10
Reliability 8/10
Median price on the 30 transactions of the last 12 months.
from 976 to
2 287  /m²
60% of transactions from the 2nd to the 8th deciles.
HousesEvolution of the price per m² of houses since...
1 year
+37%
2 years
-2.1%
3 years
+71%
4 years
+19%
5 years
+16%
6 years
+30%
7 years
+26%
8 years
+12%
9 years
+8%
10 years
+132%
11 years
+23%
The price per m² of houses has decreased by 2.1% since 2 years, but it has increased by 132% in 10 years.
ApartmentsEvolution of the price per m² of apartments since...
1 year
-11%
2 years
+10%
3 years
-19%
4 years
-19%
5 years
-3.5%
6 years
+20%
7 years
+12%
8 years
+9.4%
9 years
+24%
10 years
-28%
11 years
+39%
The price per m² of apartments has decreased by 28% since 10 years, but it has increased by 39% in 11 years.

Yearly evolution

Evolution of the median price per m²

Evolution of the median price per m² - 05 - Serres

Evolution of the number of transactions

Warning, last year incomplete. Projections made based on the proportions between semesters of the previous year at the departmental/national level and by type of property.

Evolution of the number of transactions - 05 - Serres

Yearly data

Descending order
Year
Houses
house
transactions
Houses
house
Price per m²
Apartments
apt.
transactions
Apartments
apt.
Price per m²
2025
8
2 034 
5
980 
2024
21
1 481 
11
1 102 
2023
5
2 077 
11
889 
2022
20
1 190 
13
1 212 
2021
20
1 716 
12
1 216 
2020
12
1 752 
6
1 016 
2019
14
1 568 
6
818 
2018
8
1 617 
5
878 
2017
11
1 822 
4
896 
2016
10
1 884 
6
792 
2015
7
875 
5
1 359 
2014
13
1 647 
12
704 

Analysis

Structure of prices per m²

Values of price percentiles per m² over the periods used for the estimated price of each type of property.

Structure of transaction amounts

Values of transaction amounts percentiles over the periods used for the estimated price of each type of property.

Transaction amounts and prices per m² by percentile

Ascending order
Percentile
Houses
house
Price per m²
Houses
house
Transaction amount
Apartments
apt.
Price per m²
Apartments
apt.
Transaction amount
10th percentile
1 164 
108 K
695 
41 270 
20th percentile
1 511 
132 K
782 
56 500 
30th percentile
1 627 
141 K
795 
66 500 
40th percentile
1 725 
157 K
904 
77 000 
50th percentile
1 970 
165 K
970 
90 500 
60th percentile
2 277 
186 K
1 150 
100 K
70th percentile
2 292 
213 K
1 244 
106 K
80th percentile
2 406 
252 K
1 478 
118 K
90th percentile
2 793 
330 K
1 858 
168 K

National and departmental comparison

Evolution of the median price per m² of houses

Evolution of the median price per m² of apartments

Quarterly evolution

Evolution of the median price per m²

Evolution of the number of transactions

Quarterly data

Descending order
Quarter
Houses
house
transactions
Houses
house
Price per m²
Apartments
apt.
transactions
Apartments
apt.
Price per m²
2025 Q2
3
2 299 
4
1 192 
2025 Q1
5
1 776 
1
980 
2024 Q4
4
2 382 
3
887 
2024 Q3
6
1 532 
4
1 136 
2024 Q2
3
933 
2
1 216 
2024 Q1
8
1 339 
2
1 152 
2023 Q4
3
1 504 
4
777 
2023 Q3
2
3 315 
2
1 650 
2023 Q2
0
--- 
3
889 
2023 Q1
0
--- 
2
628 
2022 Q4
4
890 
8
1 013 
2022 Q3
5
838 
3
1 357 
2022 Q2
4
1 088 
1
1 568 
2022 Q1
7
2 045 
1
714 
2021 Q4
8
1 712 
2
954 
2021 Q3
6
2 034 
5
1 060 
2021 Q2
3
1 500 
3
1 328 
2021 Q1
3
847 
2
1 488 
2020 Q4
4
1 587 
0
--- 
2020 Q3
2
1 609 
2
486 
2020 Q2
1
1 905 
1
976 
2020 Q1
5
1 647 
3
1 075 
2019 Q4
4
1 137 
3
808 
2019 Q3
4
2 091 
2
616 
2019 Q2
5
1 406 
0
--- 
2019 Q1
1
697 
1
938 
2018 Q4
1
1 567 
1
897 
2018 Q3
4
1 572 
4
752 
2018 Q2
1
592 
0
--- 
2018 Q1
2
2 130 
0
--- 
2017 Q4
2
1 370 
0
--- 
2017 Q3
2
2 456 
0
--- 
2017 Q2
6
1 810 
2
736 
2017 Q1
1
155 
2
990 
2016 Q4
3
1 749 
3
826 
2016 Q3
6
2 046 
0
--- 
2016 Q2
0
--- 
1
800 
2016 Q1
1
682 
2
475 
2015 Q4
2
1 185 
2
1 394 
2015 Q3
2
1 092 
1
1 359 
2015 Q2
3
700 
0
--- 
2015 Q1
0
--- 
2
1 011 
2014 Q4
3
1 827 
3
729 
2014 Q3
3
2 222 
5
513 
2014 Q2
2
1 206 
3
855 
2014 Q1
5
1 311 
1
898 

Overview of the latest real estate transactions

The following list is an anonymized overview of the latest transactions. For more details and to find all transactions, please use the map to view transactions by plot or the transaction search page for a search by criteria.

2025-06-16
200 000 
2 299  /m²(87 m²)
Sale
Houses
House
4 rooms
87 m2
Land
350 m2
-Sols
2025-05-28
200 
Sale
Land
9 m2
-Landes
2025-05-27
75 000 
1 923  /m²(39 m²)
Sale
Apartments
Apartment
1 room
39 m2
2 outbuildings
2025-05-23
52 700 
1 424  /m²(37 m²)
Sale
Apartments
Apartment
2 rooms
37 m2
2025-05-15
231 000 
1 036  /m²(223 m²)
Sale
Houses
House
5 rooms
223 m2
Land
3182 m2
-Terres
Land
1607 m2
-Sols
Land
14 m2
-Sols
Land
47 m2
-Landes
Land
1180 m2
-Terres
2025-05-05
300 000 
Sale
Land
195 m2
-Taillis simples
Land
300 m2
-Eaux
/CANAL
Land
454 m2
-Terres
Land
5071 m2
-Landes
Land
955 m2
-Taillis simples
Land
517 m2
-Taillis simples
2025-04-28
280 000 
2 435  /m²(115 m²)
Sale
Commercial property
115 m2
Land
14451 m2
-Taillis simples
Land
551 m2
-Landes
Land
5375 m2
-Terres
Land
1170 m2
-Landes
Land
3967 m2
-Landes
Land
780 m2
-Landes
2025-04-28
446 500 
4 961  /m²(90 m²)
Sale
Houses
House
3 rooms
90 m2
Land
2850 m2
-Landes
Land
1000 m2
-Sols
Land
15676 m2
-Taillis simples
Land
770 m2
-Landes
Land
2910 m2
-Landes
2025-04-25
154 000 
994  /m²(155 m²)
3 949  /m²(39 m²)
Sale
Apartments
Apartment
1 room
39 m2
Commercial property
116 m2
Land
72 m2
-Sols
2025-04-10
40 000 
471  /m²(85 m²)
Sale
Apartments
Apartment
4 rooms
85 m2
1 outbuilding
2025-04-07
10 000 
Sale
2 outbuildings
Land
163 m2
-Sols
2025-04-03
120 000 
960  /m²(125 m²)
Sale
Apartments
Apartment
5 rooms
74 m2
Apartments
Apartment
3 rooms
51 m2
4 outbuildings
Land
338 m2
-Landes
Land
2399 m2
-Jardins
2025-03-27
170 000 
1 619  /m²(105 m²)
Sale
Houses
House
3 rooms
105 m2
Land
480 m2
-Sols
2025-03-26
158 500 
2 642  /m²(60 m²)
Sale
Houses
House
2 rooms
60 m2
Land
440 m2
-Sols
2025-02-28
100 000 
980  /m²(102 m²)
Sale
Apartments
Apartment
2 rooms
51 m2
Apartments
Apartment
2 rooms
51 m2
2 outbuildings
2025-02-27
75 126 
transaction.nature.Vente terrain à bâtir
Land
1977 m2
-Terrains à bâtir
2025-02-10
54 000 
2 348  /m²(23 m²)
Sale
Commercial property
23 m2
2025-01-29
4 560 
Sale
Land
3700 m2
-Prés
Land
440 m2
-Taillis simples
Land
620 m2
-Terres
Land
1260 m2
-Terres
Land
125 m2
-Taillis simples
Land
2283 m2
-Landes
Land
860 m2
-Taillis simples
Land
21097 m2
-Landes
2025-01-28
214 400 
1 649  /m²(130 m²)
Sale
Houses
House
2 rooms
130 m2
Land
2395 m2
-Sols
Land
875 m2
-Taillis simples
Land
58 m2
-Terrains à bâtir
Land
57 m2
-Terrains à bâtir
2025-01-16
266 000 
2 293  /m²(116 m²)
Sale
Houses
House
5 rooms
116 m2
Land
1189 m2
-Jardins
Land
1378 m2
-Sols
449 transactions listed in the municipality

Hautes-Alpes (05)

Most expensive cities

City
name
Descending orderHouses
house
Price per m²
4 574 
4 505 
4 500 
4 459 
4 343 
4 213 
City
name
Descending orderApartments
apt.
Price per m²
4 259 
4 240 
3 690 
3 688 
3 650 
3 624 
3 429 
3 368 

Least expensive cities

City
name
Ascending orderHouses
house
Price per m²
614 
839 
861 
962 
1 052 
1 070 
1 074 
City
name
Ascending orderApartments
apt.
Price per m²
36 
271 
405 
463 
496 
644 
682 
700