emooki

Real estate price map


Real estate price map in the municipality of Orpierre, choose a section to see transactions by parcel.

Hautes-Alpes (05)

Price per m² in Orpierre

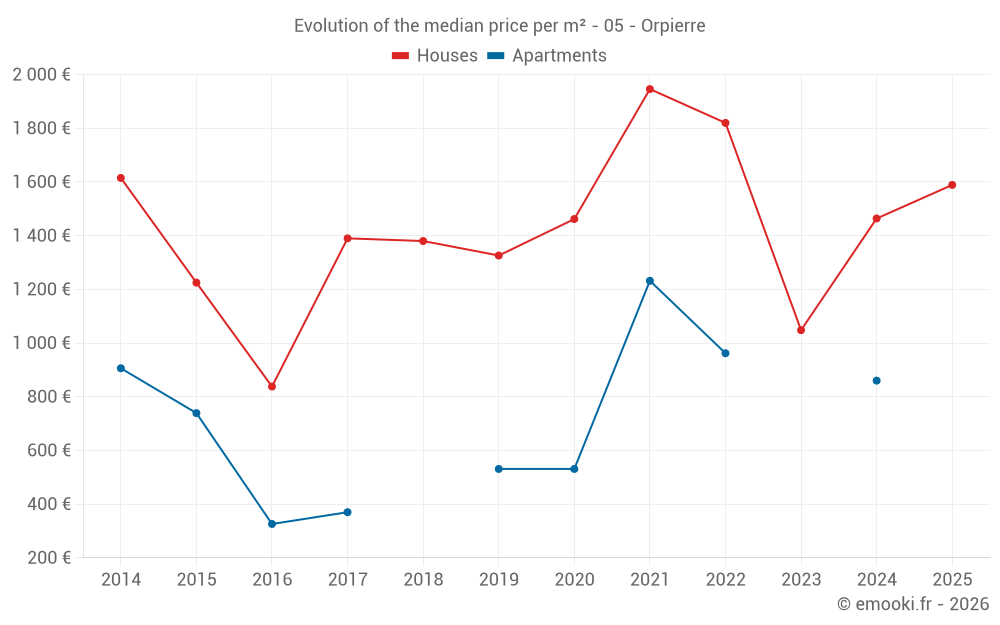
Median price of real estate
in the municipality of Orpierre

HousesHouses
1 417  /m²
1-23-45-67-89-10
Reliability 6/10
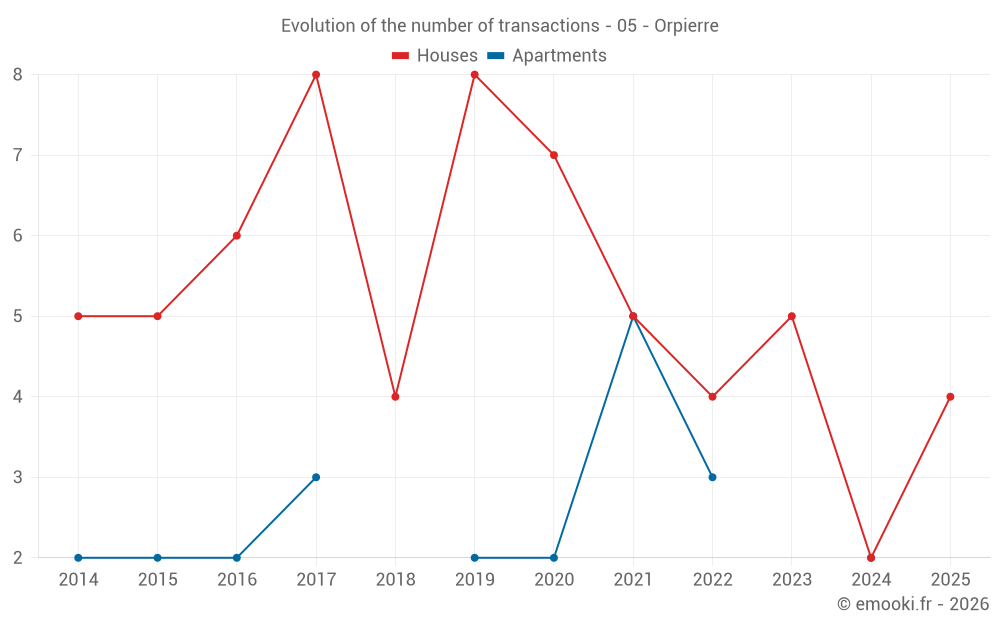
Median price on the 13 transactions of the last 36 months.
from 697 to
2 597  /m²
60% of transactions from the 2nd to the 8th deciles.
ApartmentsApartments
981  /m²
1-23-45-67-89-10
Reliability 4/10
Median price on the 12 transactions of the last 60 months.
from 747 to
1 218  /m²
60% of transactions from the 2nd to the 8th deciles.
DwellingsDwellings
1 074  /m²
1-23-45-67-89-10
Reliability 6/10
Median price on the 18 transactions of the last 36 months.
from 660 to
2 430  /m²
60% of transactions from the 2nd to the 8th deciles.
HousesEvolution of the price per m² of houses since...
1 year
--
2 years
+52%
3 years
-13%
4 years
-18%
5 years
+8.7%
6 years
+20%
7 years
+15%
8 years
+14%
9 years
+90%
10 years
+30%
11 years
-1.6%
The price per m² of houses has decreased by 18% since 4 years, but it has increased by 90% in 9 years.

170 transactions listed in the municipality

Yearly data

Yearly evolution of the median price per m²

Yearly evolution of the median price per m² - 05 - Orpierre

Yearly evolution of the number of transactions

Warning, last year incomplete. Projections made based on the proportions between semesters of the previous year at the departmental/national level and by type of property.

Yearly evolution of the number of transactions - 05 - Orpierre

Yearly table

Descending order
Year
Houses
house
transactions
Houses
house
Price per m²
Apartments
apt.
transactions
Apartments
apt.
Price per m²
2025
4
1 589 
0
--- 
2024
2
1 464 
2
860 
2023
5
1 048 
0
--- 
2022
4
1 820 
3
962 
2021
5
1 946 
5
1 232 
2020
7
1 462 
2
531 
2019
8
1 326 
2
531 
2018
4
1 380 
0
--- 
2017
8
1 390 
3
370 
2016
6
838 
2
326 
2015
5
1 225 
2
739 
2014
5
1 615 
2
906 

Analysis

Structure of prices per m²

Values of price percentiles per m² over the periods used for the estimated price of each type of property.

Structure of transaction amounts

Values of transaction amounts percentiles over the periods used for the estimated price of each type of property.

Transaction amounts and prices per m² by percentile

Ascending order
Percentile
Houses
house
Price per m²
Houses
house
Transaction amount
Apartments
apt.
Price per m²
Apartments
apt.
Transaction amount
10th percentile
365 
41 200 
603 
50 800 
20th percentile
697 
74 896 
747 
58 000 
30th percentile
1 045 
83 176 
824 
60 250 
40th percentile
1 090 
117 K
956 
69 300 
50th percentile
1 417 
163 K
981 
76 500 
60th percentile
1 869 
216 K
1 070 
98 400 
70th percentile
2 387 
301 K
1 147 
148 K
80th percentile
2 597 
362 K
1 218 
173 K
90th percentile
2 794 
439 K
1 313 
198 K

National and departmental comparison

Evolution of the median price per m² of houses

Evolution of the median price per m² of apartments

Quarterly data

Quarterly evolution of the median price per m²

Quarterly evolution of the number of transactions

Quarterly table

Descending order
Quarter
Houses
house
transactions
Houses
house
Price per m²
Apartments
apt.
transactions
Apartments
apt.
Price per m²
2025 Q2
2
2 138 
0
--- 
2025 Q1
2
1 259 
0
--- 
2024 Q2
2
1 464 
2
860 
2023 Q3
2
3 000 
0
--- 
2023 Q2
2
1 321 
0
--- 
2023 Q1
1
1 048 
0
--- 
2022 Q4
2
1 648 
2
874 
2022 Q3
0
--- 
1
962 
2022 Q2
1
992 
0
--- 
2022 Q1
1
2 647 
0
--- 
2021 Q4
1
1 946 
1
1 322 
2021 Q3
3
1 688 
2
1 058 
2021 Q2
0
--- 
1
2 320 
2021 Q1
1
2 650 
1
1 232 
2020 Q4
2
1 770 
1
320 
2020 Q3
2
1 140 
1
742 
2020 Q2
2
826 
0
--- 
2020 Q1
1
1 649 
0
--- 
2019 Q4
0
--- 
1
784 
2019 Q3
2
1 836 
1
278 
2019 Q2
3
385 
0
--- 
2019 Q1
3
1 229 
0
--- 
2018 Q4
4
1 380 
0
--- 
2017 Q4
4
1 486 
1
370 
2017 Q3
1
828 
0
--- 
2017 Q2
2
1 222 
1
795 
2017 Q1
1
1 951 
1
245 
2016 Q4
2
1 683 
0
--- 
2016 Q3
1
4 500 
1
302 
2016 Q2
1
100 
1
350 
2016 Q1
2
114 
0
--- 
2015 Q4
1
1 289 
1
682 
2015 Q3
3
1 225 
0
--- 
2015 Q2
1
1 192 
0
--- 
2015 Q1
0
--- 
1
796 
2014 Q4
1
1 350 
0
--- 
2014 Q3
2
1 702 
0
--- 
2014 Q2
0
--- 
1
1 042 
2014 Q1
2
1 848 
1
769 

Compare with neighboring municipalities

City
name
Descending orderHouses
house
Price per m²
Apartments
apt.
Price per m²
2 174 
1 522 
2 026 
550 
1 975 
1 466 
1 676 
1 842 
1 501 
--- 
1 417 
981 
1 379 
--- 
1 339 
--- 
1 052 
--- 
828 
--- 

City information

Zip code

  • 05700 ORPIERRE