emooki
HomePrice mapTransactions
🇬🇧 English🇫🇷 Français🇩🇪 Deutsch🇪🇸 Español🇮🇹 Italiano

Real estate price map


Real estate price map in the municipality of Chabottes, choose a section to see transactions by parcel.

Hautes-Alpes (05)

Chabottes - Real estate price m²

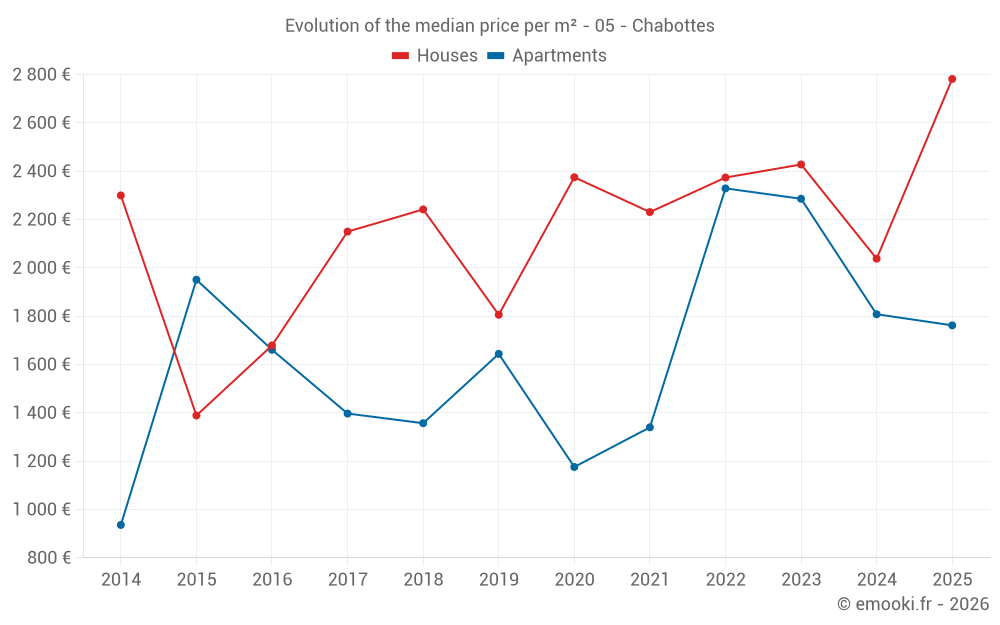
Median price of real estate
in the municipality of Chabottes

HousesHouses
2 473  /m²
1-23-45-67-89-10
Reliability 6/10
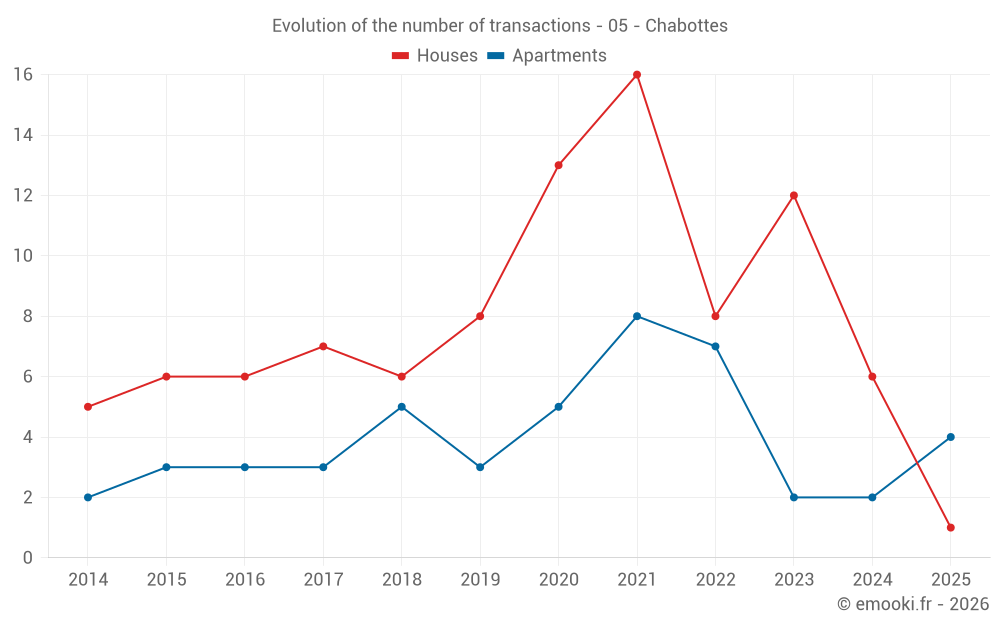
Median price on the 22 transactions of the last 36 months.
from 1 612 to
2 793  /m²
60% of transactions from the 2nd to the 8th deciles.
ApartmentsApartments
2 186  /m²
1-23-45-67-89-10
Reliability 5/10
Median price on the 19 transactions of the last 48 months.
from 1 409 to
2 345  /m²
60% of transactions from the 2nd to the 8th deciles.
DwellingsDwellings
2 300  /m²
1-23-45-67-89-10
Reliability 7/10
Median price on the 20 transactions of the last 24 months.
from 1 585 to
2 616  /m²
60% of transactions from the 2nd to the 8th deciles.
ApartmentsEvolution of the price per m² of apartments since...
1 year
--
2 years
--
3 years
-24%
4 years
+31%
5 years
+50%
6 years
--
7 years
+30%
8 years
--
9 years
--
10 years
--
11 years
--
The price per m² of apartments has decreased by 24% since 3 years, but it has increased by 50% in 5 years.

Yearly evolution

Evolution of the median price per m²

Evolution of the median price per m² - 05 - Chabottes

Evolution of the number of transactions

Warning, last year incomplete. Projections made based on the proportions between semesters of the previous year at the departmental/national level and by type of property.

Evolution of the number of transactions - 05 - Chabottes

Yearly data

Descending order
Year
Houses
house
transactions
Houses
house
Price per m²
Apartments
apt.
transactions
Apartments
apt.
Price per m²
2025
1
2 782 
4
1 762 
2024
6
2 038 
2
1 808 
2023
12
2 428 
2
2 286 
2022
8
2 374 
7
2 329 
2021
16
2 231 
8
1 340 
2020
13
2 375 
5
1 176 
2019
8
1 806 
3
1 644 
2018
6
2 242 
5
1 357 
2017
7
2 150 
3
1 397 
2016
6
1 679 
3
1 661 
2015
6
1 389 
3
1 951 
2014
5
2 300 
2
936 

Analysis

Structure of prices per m²

Values of price percentiles per m² over the periods used for the estimated price of each type of property.

Structure of transaction amounts

Values of transaction amounts percentiles over the periods used for the estimated price of each type of property.

Transaction amounts and prices per m² by percentile

Ascending order
Percentile
Houses
house
Price per m²
Houses
house
Transaction amount
Apartments
apt.
Price per m²
Apartments
apt.
Transaction amount
10th percentile
1 263 
112 K
1 053 
77 110 
20th percentile
1 612 
148 K
1 409 
82 520 
30th percentile
1 840 
178 K
1 827 
87 450 
40th percentile
2 251 
216 K
2 014 
101 K
50th percentile
2 473 
252 K
2 186 
105 K
60th percentile
2 590 
268 K
2 269 
126 K
70th percentile
2 751 
299 K
2 320 
130 K
80th percentile
2 793 
342 K
2 345 
144 K
90th percentile
3 293 
359 K
2 395 
185 K

National and departmental comparison

Evolution of the median price per m² of houses

Evolution of the median price per m² of apartments

Quarterly evolution

Evolution of the median price per m²

Evolution of the number of transactions

Quarterly data

Descending order
Quarter
Houses
house
transactions
Houses
house
Price per m²
Apartments
apt.
transactions
Apartments
apt.
Price per m²
2025 Q2
0
--- 
1
1 455 
2025 Q1
1
2 782 
3
2 069 
2024 Q4
1
1 000 
2
1 808 
2024 Q2
2
2 736 
0
--- 
2024 Q1
3
1 693 
0
--- 
2023 Q4
3
2 574 
0
--- 
2023 Q3
2
2 391 
2
2 286 
2023 Q2
4
1 943 
0
--- 
2023 Q1
3
1 611 
0
--- 
2022 Q4
2
2 854 
1
2 682 
2022 Q3
1
2 223 
1
2 362 
2022 Q2
3
1 840 
3
2 329 
2022 Q1
2
2 930 
2
2 232 
2021 Q4
1
3 500 
1
2 000 
2021 Q3
6
2 272 
3
1 339 
2021 Q2
5
1 927 
1
1 680 
2021 Q1
4
2 231 
3
1 200 
2020 Q4
3
2 182 
2
1 143 
2020 Q3
6
2 192 
2
1 910 
2020 Q2
2
2 665 
0
--- 
2020 Q1
2
2 356 
1
987 
2019 Q4
1
923 
2
1 410 
2019 Q3
6
1 854 
0
--- 
2019 Q1
1
2 070 
1
1 842 
2018 Q4
1
2 756 
3
1 120 
2018 Q3
1
2 172 
1
1 357 
2018 Q2
2
1 420 
0
--- 
2018 Q1
2
2 430 
1
1 556 
2017 Q4
3
2 150 
2
1 388 
2017 Q3
0
--- 
1
1 397 
2017 Q2
2
3 210 
0
--- 
2017 Q1
2
1 102 
0
--- 
2016 Q4
2
1 522 
0
--- 
2016 Q3
2
1 792 
1
2 143 
2016 Q2
1
2 122 
2
1 504 
2016 Q1
1
1 708 
0
--- 
2015 Q4
1
1 320 
0
--- 
2015 Q3
1
1 715 
1
2 208 
2015 Q2
2
1 262 
1
1 525 
2015 Q1
2
1 254 
1
1 951 
2014 Q4
0
--- 
1
1 310 
2014 Q3
1
2 340 
0
--- 
2014 Q2
2
2 712 
0
--- 
2014 Q1
2
1 341 
1
563 

Overview of the latest real estate transactions

The following list is an anonymized overview of the latest transactions. For more details and to find all transactions, please use the map to view transactions by plot or the transaction search page for a search by criteria.

2025-06-06
80 000 
1 455  /m²(55 m²)
Sale
Apartments
Apartment
3 rooms
55 m2
1 outbuilding
Land
12 m2
-Sols
Land
742 m2
-Terres
2025-03-27
120 000 
2 069  /m²(58 m²)
Sale
Apartments
Apartment
3 rooms
58 m2
1 outbuilding
2025-03-21
306 000 
2 782  /m²(110 m²)
Sale
Houses
House
5 rooms
110 m2
1 outbuilding
Land
1527 m2
-Sols
2025-03-19
60 000 
500  /m²(120 m²)
Sale
Apartments
Apartment
1 room
120 m2
2025-03-18
95 000 
Sale
Land
615 m2
-Terrains à bâtir
2025-03-04
72 600 
Sale
Land
480 m2
-Terrains à bâtir
Land
107 m2
-Terrains à bâtir
Land
371 m2
-Terrains à bâtir
2025-03-03
180 
Sale
Land
19 m2
-Jardins
2025-03-03
267 500 
2 306  /m²(116 m²)
Sale
Apartments
Apartment
3 rooms
55 m2
Apartments
Apartment
4 rooms
61 m2
Land
707 m2
-Sols
Land
115 m2
-Jardins
2025-01-08
7 000 
Sale
Land
464 m2
-Landes
2024-12-27
70 000 
1 000  /m²(70 m²)
Sale
Houses
House
4 rooms
70 m2
Land
272 m2
-Sols
Land
205 m2
-Jardins
Land
245 m2
-Prés
2024-11-28
84 200 
1 094  /m²(77 m²)
Sale
Apartments
Apartment
2 rooms
32 m2
Apartments
Apartment
3 rooms
45 m2
2 outbuildings
1 outbuilding
2024-11-21
22 700 
Sale
Land
3800 m2
-Prés
Land
1990 m2
-Futaies feuillues
Land
5120 m2
-Terres
Land
2790 m2
-Taillis simples
Land
2890 m2
-Terres
Land
1520 m2
-Terres
Land
1720 m2
-Taillis simples
Land
5850 m2
-Taillis simples
Land
4000 m2
-Terres
Land
5170 m2
-Terres
Land
22100 m2
-Terres
Land
18920 m2
-Terres
Land
4160 m2
-Prés
2024-11-06
65 550 
2 521  /m²(26 m²)
Sale
Apartments
Apartment
2 rooms
26 m2
2024-10-15
1 
Sale
Land
332 m2
-Terres
Land
609 m2
-Landes
Land
48 m2
-Terres
Land
230 m2
-Terres
Land
640 m2
-Terres
Land
618 m2
-Landes
Land
553 m2
-Landes
Land
281 m2
-Terres
Land
30 m2
-Terres
Land
164 m2
-Landes
Land
341 m2
-Landes
2024-10-15
1 
Sale
Land
332 m2
-Terres
Land
230 m2
-Terres
Land
553 m2
-Landes
Land
30 m2
-Terres
Land
341 m2
-Landes
2024-07-26
180 000 
Sale
Land
133 m2
-Prés
Land
400 m2
-Prés
Land
400 m2
-Prés
Land
412 m2
-Prés
Land
478 m2
-Prés
Land
480 m2
-Prés
Land
107 m2
-Prés
Land
185 m2
-Prés
Land
90 m2
-Prés
Land
267 m2
-Prés
Land
371 m2
-Prés
Land
535 m2
-Prés
Land
615 m2
-Prés
Land
484 m2
-Prés
2024-06-12
346 500 
2 794  /m²(124 m²)
Sale
Houses
House
5 rooms
124 m2
Land
595 m2
-Sols
2024-05-30
377 740 
2 679  /m²(141 m²)
Sale
Houses
House
5 rooms
101 m2
Land
821 m2
-Sols
Houses
House
3 rooms
40 m2
Land
92 m2
-Sols
Land
45 m2
-Sols
Land
11 m2
-Sols
Land
11 m2
-Sols
2024-03-15
254 000 
1 693  /m²(150 m²)
Sale
Houses
House
6 rooms
150 m2
Land
237 m2
-Sols
Land
384 m2
-Sols
Land
6 m2
-Terres
2024-03-15
364 800 
2 384  /m²(153 m²)
Sale
Houses
House
6 rooms
153 m2
Land
997 m2
-Sols
243 transactions listed in the municipality

Hautes-Alpes (05)

Most expensive cities

City
name
Descending orderHouses
house
Price per m²
4 574 
4 505 
4 500 
4 459 
4 343 
4 213 
City
name
Descending orderApartments
apt.
Price per m²
4 259 
4 240 
3 690 
3 688 
3 650 
3 624 
3 429 
3 368 

Least expensive cities

City
name
Ascending orderHouses
house
Price per m²
614 
839 
861 
962 
1 052 
1 070 
1 074 
City
name
Ascending orderApartments
apt.
Price per m²
36 
271 
405 
463 
496 
644 
682 
700