emooki
HomePrice mapTransactions
🇬🇧 English🇫🇷 Français🇩🇪 Deutsch🇪🇸 Español🇮🇹 Italiano

Real estate price map


Real estate price map in the municipality of Méolans-Revel.

Alpes-de-Haute-Provence (04)
Méolans-Revel

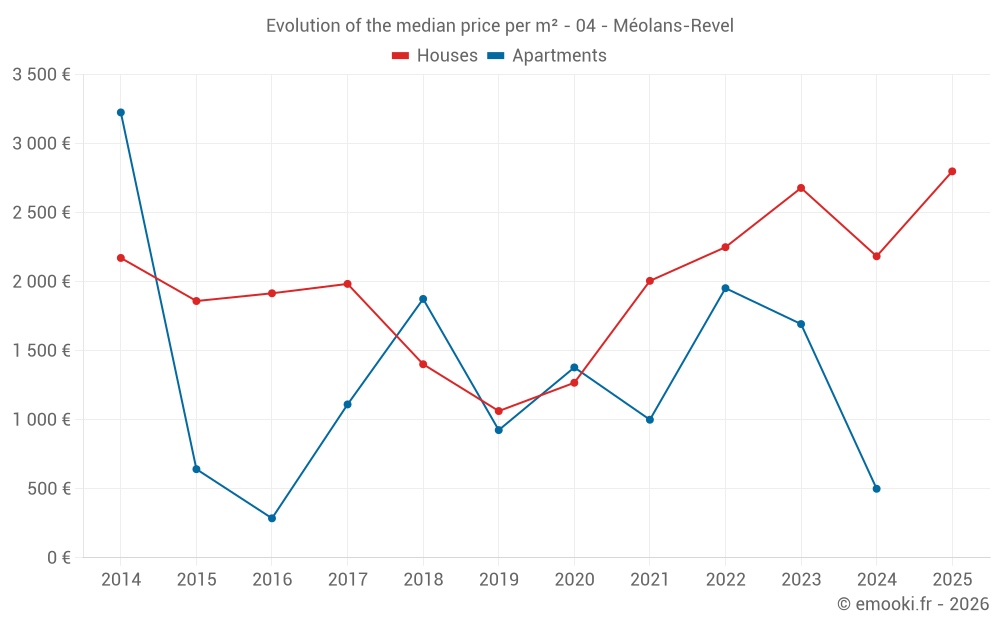
Median price of real estate
in the municipality of Méolans-Revel

HousesHouses
2 297  /m²
1-23-45-67-89-10
Reliability 7/10
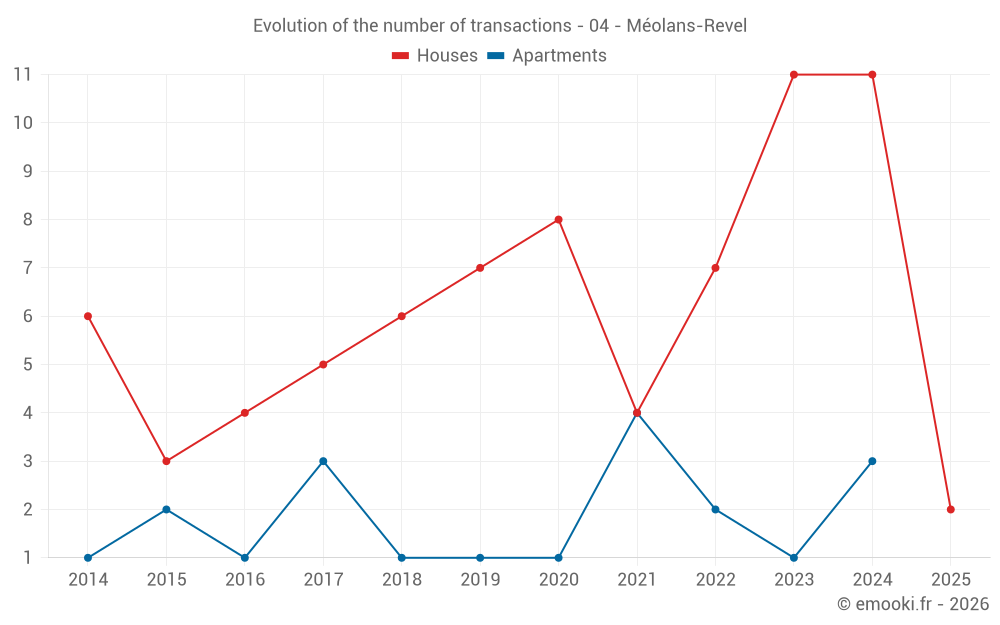
Median price on the 17 transactions of the last 24 months.
from 1 155 to
3 578  /m²
60% of transactions from the 2nd to the 8th deciles.
ApartmentsApartments
1 000  /m²
1-23-45-67-89-10
Reliability 4/10
Median price on the 10 transactions of the last 60 months.
DwellingsDwellings
2 251  /m²
1-23-45-67-89-10
Reliability 7/10
Median price on the 21 transactions of the last 24 months.
from 938 to
3 400  /m²
60% of transactions from the 2nd to the 8th deciles.
HousesEvolution of the price per m² of houses since...
1 year
--
2 years
--
3 years
--
4 years
--
5 years
--
6 years
--
7 years
--
8 years
--
9 years
--
10 years
--
11 years
--
ApartmentsEvolution of the price per m² of apartments since...
1 year
--
2 years
--
3 years
--
4 years
--
5 years
--
6 years
--
7 years
--
8 years
--
9 years
--
10 years
--
11 years
--

Yearly evolution

Evolution of the median price per m²

Evolution of the number of transactions

Warning, last year incomplete. Projections made based on the proportions between semesters of the previous year at the departmental/national level and by type of property.

Yearly data

Descending order
Year
Houses
house
transactions
Houses
house
Price per m²
Apartments
apt.
transactions
Apartments
apt.
Price per m²
2025
2
2 799 
0
--- 
2024
11
2 184 
3
500 
2023
11
2 679 
1
1 693 
2022
7
2 250 
2
1 953 
2021
4
2 006 
4
1 000 
2020
8
1 268 
1
1 379 
2019
7
1 063 
1
925 
2018
6
1 402 
1
1 875 
2017
5
1 984 
3
1 111 
2016
4
1 916 
1
286 
2015
3
1 860 
2
642 
2014
6
2 172 
1
3 226 

Analysis

Structure of prices per m²

Values of price percentiles per m² over the periods used for the estimated price of each type of property.

Structure of transaction amounts

Values of transaction amounts percentiles over the periods used for the estimated price of each type of property.

Transaction amounts and prices per m² by percentile

Ascending order
Percentile
Houses
house
Price per m²
Houses
house
Transaction amount
Apartments
apt.
Price per m²
Apartments
apt.
Transaction amount
10th percentile
881 
64 504 
485 
27 500 
20th percentile
1 155 
91 920 
691 
57 500 
30th percentile
1 759 
116 K
804 
82 885 
40th percentile
2 211 
132 K
901 
99 311 
50th percentile
2 297 
153 K
1 000 
117 K
60th percentile
2 601 
176 K
1 309 
165 K
70th percentile
3 080 
227 K
1 722 
222 K
80th percentile
3 578 
330 K
1 937 
237 K
90th percentile
3 811 
411 K
2 593 
271 K

National and departmental comparison

Evolution of the median price per m² of houses

Evolution of the median price per m² of apartments

Quarterly evolution

Evolution of the median price per m²

Evolution of the number of transactions

Quarterly data

Descending order
Quarter
Houses
house
transactions
Houses
house
Price per m²
Apartments
apt.
transactions
Apartments
apt.
Price per m²
2025 Q1
2
2 799 
0
--- 
2024 Q4
4
1 523 
0
--- 
2024 Q3
1
938 
3
500 
2024 Q2
3
3 623 
0
--- 
2024 Q1
3
2 184 
0
--- 
2023 Q4
2
3 030 
1
1 693 
2023 Q3
2
3 113 
0
--- 
2023 Q2
1
1 159 
0
--- 
2023 Q1
6
2 816 
0
--- 
2022 Q4
1
2 000 
1
739 
2022 Q2
2
2 700 
0
--- 
2022 Q1
4
2 112 
1
3 167 
2021 Q4
2
1 906 
0
--- 
2021 Q3
1
1 746 
0
--- 
2021 Q2
0
--- 
2
1 310 
2021 Q1
1
2 265 
2
1 000 
2020 Q4
1
1 104 
0
--- 
2020 Q3
3
2 767 
0
--- 
2020 Q1
4
1 192 
1
1 379 
2019 Q4
3
635 
0
--- 
2019 Q3
2
1 404 
0
--- 
2019 Q1
2
1 313 
1
925 
2018 Q4
2
1 820 
0
--- 
2018 Q3
1
1 613 
0
--- 
2018 Q2
1
107 
1
1 875 
2018 Q1
2
908 
0
--- 
2017 Q4
1
914 
1
537 
2017 Q3
2
1 954 
0
--- 
2017 Q2
0
--- 
1
1 111 
2017 Q1
2
2 624 
1
1 706 
2016 Q4
2
2 786 
0
--- 
2016 Q3
1
1 038 
1
286 
2016 Q2
1
2 458 
0
--- 
2015 Q4
2
2 090 
1
408 
2015 Q3
0
--- 
1
875 
2015 Q2
1
1 860 
0
--- 
2014 Q3
1
2 542 
0
--- 
2014 Q2
1
324 
0
--- 
2014 Q1
4
2 172 
1
3 226 

Alpes-de-Haute-Provence (04)

Most expensive cities

City
name
Descending orderHouses
house
Price per m²
4 318 
3 484 
3 440 
3 310 
3 174 
City
name
Descending orderApartments
apt.
Price per m²
100 000 
3 360 
3 063 
2 803 
2 734 
2 638 
2 558 

Least expensive cities

City
name
Ascending orderHouses
house
Price per m²
570 
600 
1 032 
1 096 
1 167 
1 202 
1 207 
City
name
Ascending orderApartments
apt.
Price per m²
132 
379 
489 
543 
592 
625 
668 
679