emooki
HomePrice mapTransactions
🇬🇧 English🇫🇷 Français🇩🇪 Deutsch🇪🇸 Español🇮🇹 Italiano

Real estate price map


Real estate price map in the municipality of Les Mées.

Alpes-de-Haute-Provence (04)
Les Mées

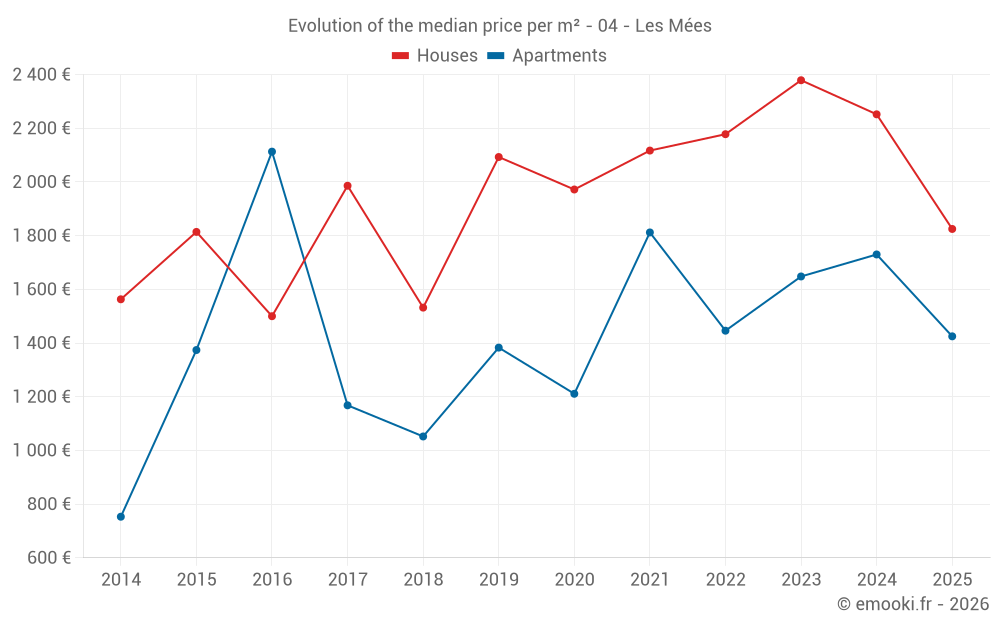
Median price of real estate
in the municipality of Les Mées

HousesHouses
2 055  /m²
1-23-45-67-89-10
Reliability 8/10
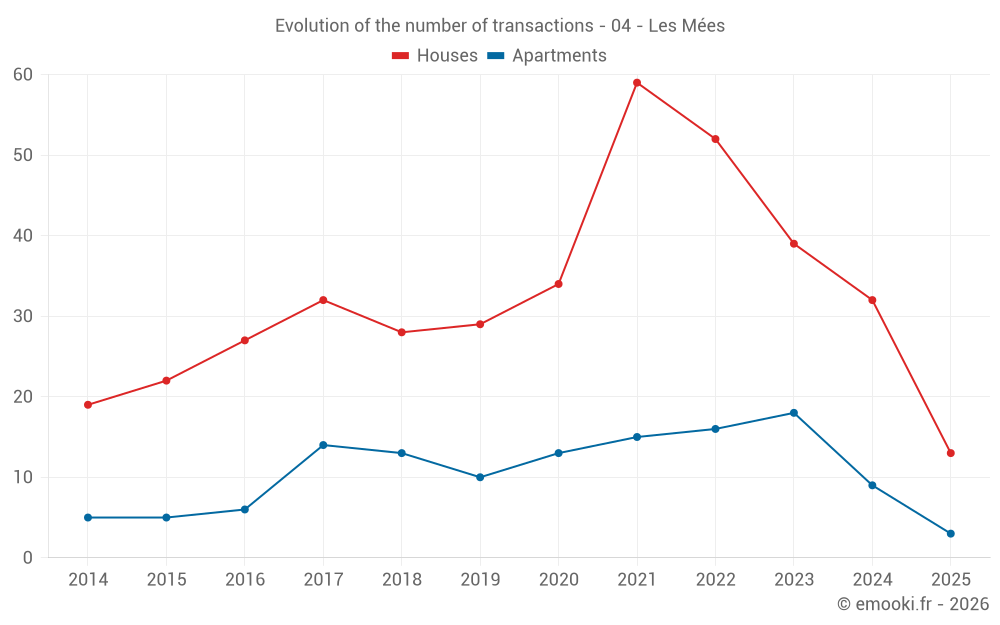
Median price on the 29 transactions of the last 12 months.
from 1 532 to
2 945  /m²
60% of transactions from the 2nd to the 8th deciles.
ApartmentsApartments
1 425  /m²
1-23-45-67-89-10
Reliability 7/10
Median price on the 21 transactions of the last 24 months.
from 964 to
2 179  /m²
60% of transactions from the 2nd to the 8th deciles.
DwellingsDwellings
2 014  /m²
1-23-45-67-89-10
Reliability 8/10
Median price on the 36 transactions of the last 12 months.
from 1 429 to
2 809  /m²
60% of transactions from the 2nd to the 8th deciles.
HousesEvolution of the price per m² of houses since...
1 year
-19%
2 years
-23%
3 years
-16%
4 years
-14%
5 years
-7.5%
6 years
-13%
7 years
+19%
8 years
-8.1%
9 years
+22%
10 years
+0.6%
11 years
+17%
ApartmentsEvolution of the price per m² of apartments since...
1 year
--
2 years
--
3 years
--
4 years
--
5 years
--
6 years
--
7 years
--
8 years
--
9 years
--
10 years
--
11 years
--

Yearly evolution

Evolution of the median price per m²

Evolution of the number of transactions

Warning, last year incomplete. Projections made based on the proportions between semesters of the previous year at the departmental/national level and by type of property.

Yearly data

Descending order
Year
Houses
house
transactions
Houses
house
Price per m²
Apartments
apt.
transactions
Apartments
apt.
Price per m²
2025
13
1 825 
3
1 425 
2024
32
2 252 
9
1 730 
2023
39
2 379 
18
1 648 
2022
52
2 178 
16
1 446 
2021
59
2 117 
15
1 812 
2020
34
1 972 
13
1 211 
2019
29
2 093 
10
1 383 
2018
28
1 532 
13
1 052 
2017
32
1 986 
14
1 168 
2016
27
1 500 
6
2 113 
2015
22
1 814 
5
1 374 
2014
19
1 563 
5
753 

Analysis

Structure of prices per m²

Values of price percentiles per m² over the periods used for the estimated price of each type of property.

Structure of transaction amounts

Values of transaction amounts percentiles over the periods used for the estimated price of each type of property.

Transaction amounts and prices per m² by percentile

Ascending order
Percentile
Houses
house
Price per m²
Houses
house
Transaction amount
Apartments
apt.
Price per m²
Apartments
apt.
Transaction amount
10th percentile
981 
54 800 
632 
43 000 
20th percentile
1 532 
72 740 
964 
60 000 
30th percentile
1 741 
144 K
1 300 
68 000 
40th percentile
1 886 
181 K
1 356 
91 000 
50th percentile
2 055 
200 K
1 425 
104 K
60th percentile
2 396 
219 K
1 730 
122 K
70th percentile
2 597 
245 K
1 941 
165 K
80th percentile
2 945 
262 K
2 179 
189 K
90th percentile
3 255 
303 K
2 756 
228 K

National and departmental comparison

Evolution of the median price per m² of houses

Evolution of the median price per m² of apartments

Quarterly evolution

Evolution of the median price per m²

Evolution of the number of transactions

Quarterly data

Descending order
Quarter
Houses
house
transactions
Houses
house
Price per m²
Apartments
apt.
transactions
Apartments
apt.
Price per m²
2025 Q2
5
1 702 
0
--- 
2025 Q1
8
2 096 
3
1 425 
2024 Q4
11
2 055 
2
1 872 
2024 Q3
5
2 606 
2
2 270 
2024 Q2
7
2 332 
5
1 300 
2024 Q1
9
1 651 
0
--- 
2023 Q4
11
2 288 
3
964 
2023 Q3
12
2 272 
6
1 946 
2023 Q2
6
2 520 
5
1 583 
2023 Q1
10
2 574 
4
2 578 
2022 Q4
14
1 854 
2
2 134 
2022 Q3
13
2 722 
4
993 
2022 Q2
15
1 917 
5
1 071 
2022 Q1
10
2 111 
5
1 727 
2021 Q4
22
2 204 
2
2 628 
2021 Q3
13
2 264 
3
1 846 
2021 Q2
13
2 063 
7
1 392 
2021 Q1
11
1 854 
3
1 096 
2020 Q4
12
2 262 
7
1 293 
2020 Q3
6
2 031 
3
667 
2020 Q2
6
1 972 
1
1 953 
2020 Q1
10
1 677 
2
807 
2019 Q4
8
2 080 
2
2 731 
2019 Q3
7
1 846 
1
669 
2019 Q2
3
1 938 
3
1 184 
2019 Q1
11
2 247 
4
1 383 
2018 Q4
9
1 523 
5
1 072 
2018 Q3
8
1 872 
1
642 
2018 Q2
7
1 542 
4
1 074 
2018 Q1
4
1 327 
3
681 
2017 Q4
11
1 761 
3
1 257 
2017 Q3
8
2 022 
4
1 668 
2017 Q2
11
2 012 
4
1 368 
2017 Q1
2
2 182 
3
927 
2016 Q4
11
1 696 
2
2 414 
2016 Q3
3
1 321 
3
2 067 
2016 Q2
6
1 522 
1
1 222 
2016 Q1
7
1 500 
0
--- 
2015 Q4
5
1 463 
2
1 160 
2015 Q3
4
1 100 
1
1 449 
2015 Q2
6
1 824 
0
--- 
2015 Q1
7
1 938 
2
1 982 
2014 Q4
2
1 635 
0
--- 
2014 Q3
5
1 830 
3
2 105 
2014 Q2
5
1 447 
1
753 
2014 Q1
7
1 429 
1
465 

Alpes-de-Haute-Provence (04)

Most expensive cities

City
name
Descending orderHouses
house
Price per m²
4 318 
3 484 
3 440 
3 310 
3 174 
City
name
Descending orderApartments
apt.
Price per m²
100 000 
3 360 
3 063 
2 803 
2 734 
2 638 
2 558 

Least expensive cities

City
name
Ascending orderHouses
house
Price per m²
570 
600 
1 032 
1 096 
1 167 
1 202 
1 207 
City
name
Ascending orderApartments
apt.
Price per m²
132 
379 
489 
543 
592 
625 
668 
679