Median price of real estate
in the municipality of Digne-les-Bains
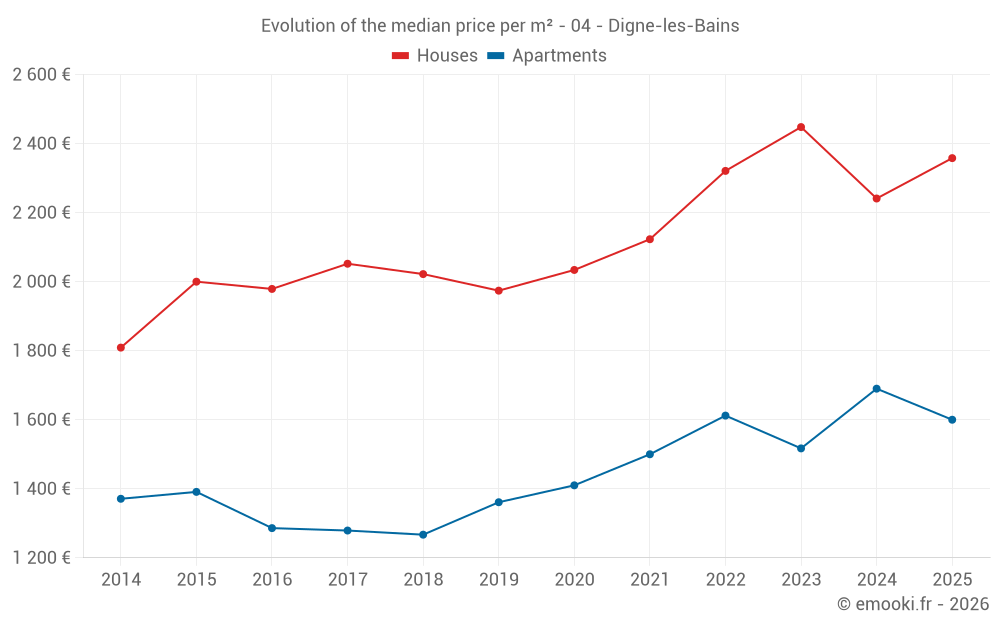
Houses
2 358 € /m²
Reliability 9/10
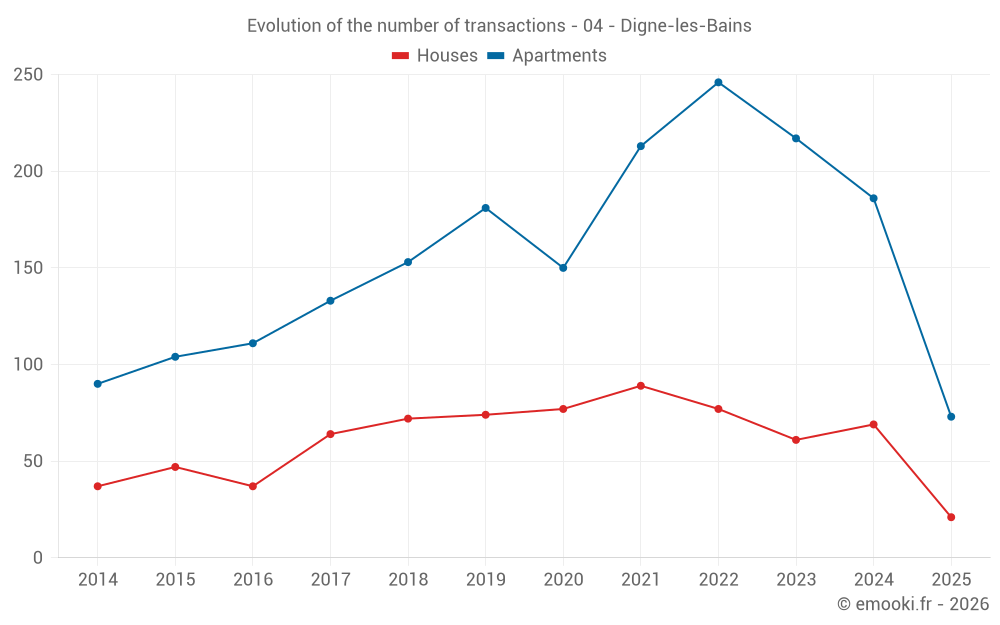
Median price on the 21 transactions of the last 6 months.
from 1 690 to
2 953 € /m²
2 953 € /m²
60% of transactions from the 2nd to the 8th deciles.
Apartments
1 600 € /m²
Reliability 9/10
Median price on the 73 transactions of the last 6 months.
from 1 081 to
2 116 € /m²
2 116 € /m²
60% of transactions from the 2nd to the 8th deciles.
Dwellings
1 667 € /m²
Reliability 10/10
Median price on the 21 transactions of the last 3 months.
from 1 209 to
2 333 € /m²
2 333 € /m²
60% of transactions from the 2nd to the 8th deciles.