emooki
HomePrice mapTransactions
🇬🇧 English🇫🇷 Français🇩🇪 Deutsch🇪🇸 Español🇮🇹 Italiano

Real estate price map


Real estate price map in the municipality of La Brillanne, choose a section to see transactions by parcel.

Alpes-de-Haute-Provence (04)

La Brillanne - Real estate price m²

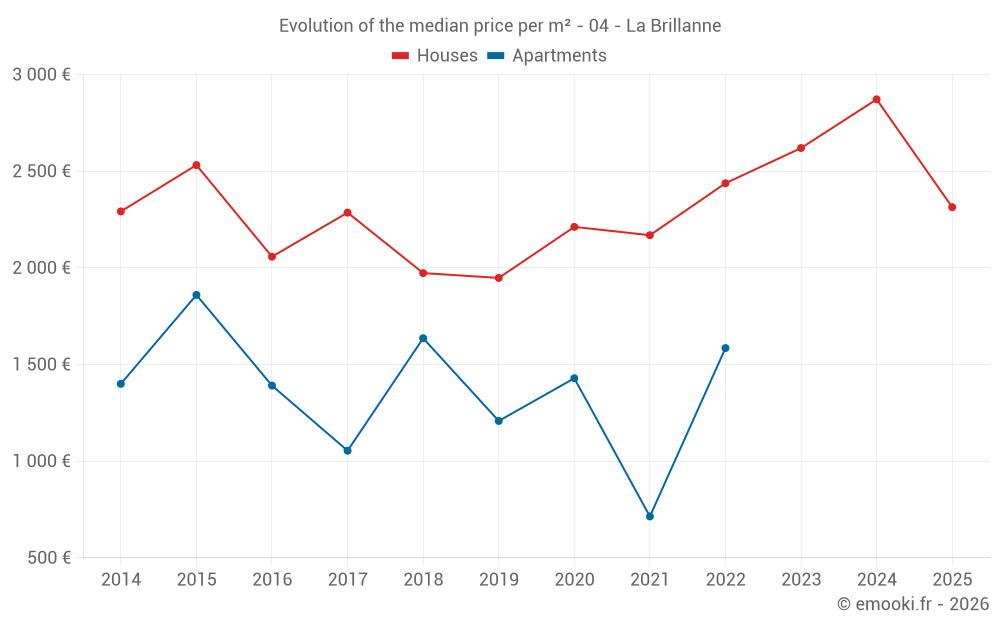
Median price of real estate
in the municipality of La Brillanne

HousesHouses
2 470  /m²
1-23-45-67-89-10
Reliability 6/10
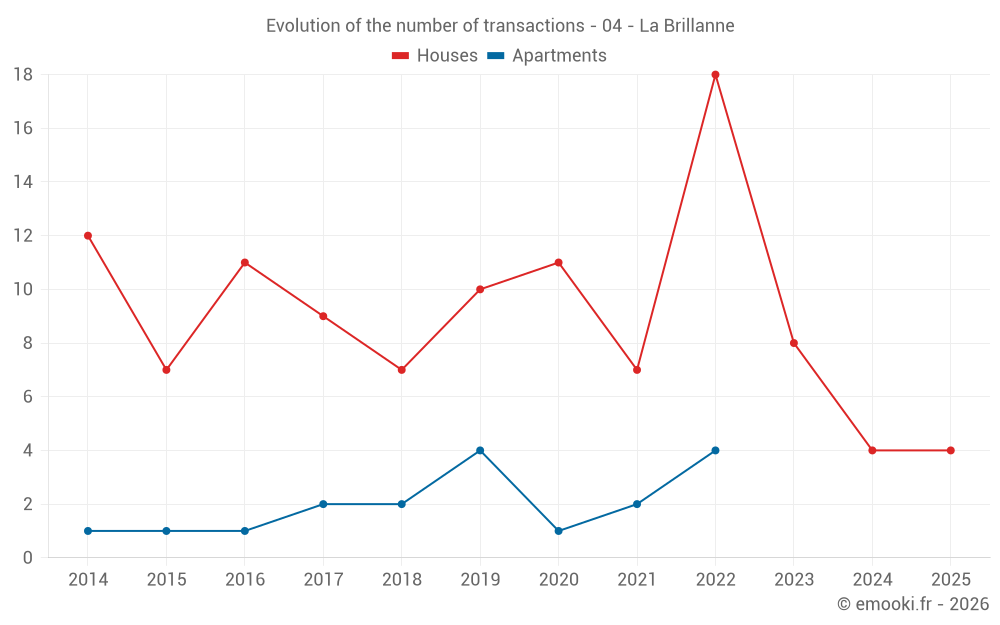
Median price on the 25 transactions of the last 36 months.
from 1 739 to
3 029  /m²
60% of transactions from the 2nd to the 8th deciles.
ApartmentsApartments
1 315  /m²
1-23-45-67-89-10
Reliability 3/10
Median price on the 10 transactions of the last 72 months.
DwellingsDwellings
2 317  /m²
1-23-45-67-89-10
Reliability 6/10
Median price on the 27 transactions of the last 36 months.
from 1 638 to
3 016  /m²
60% of transactions from the 2nd to the 8th deciles.
HousesEvolution of the price per m² of houses since...
1 year
-19%
2 years
-12%
3 years
-5.1%
4 years
+6.7%
5 years
+4.6%
6 years
+19%
7 years
+17%
8 years
+1.2%
9 years
+12%
10 years
-8.6%
11 years
+1%
The price per m² of houses has decreased by 19% since 1 year, but it has increased by 19% in 6 years.

Yearly evolution

Evolution of the median price per m²

Evolution of the median price per m² - 04 - La Brillanne

Evolution of the number of transactions

Warning, last year incomplete. Projections made based on the proportions between semesters of the previous year at the departmental/national level and by type of property.

Evolution of the number of transactions - 04 - La Brillanne

Yearly data

Descending order
Year
Houses
house
transactions
Houses
house
Price per m²
Apartments
apt.
transactions
Apartments
apt.
Price per m²
2025
4
2 314 
0
--- 
2024
4
2 872 
0
--- 
2023
8
2 620 
0
--- 
2022
18
2 438 
4
1 585 
2021
7
2 169 
2
714 
2020
11
2 212 
1
1 429 
2019
10
1 948 
4
1 208 
2018
7
1 973 
2
1 636 
2017
9
2 286 
2
1 054 
2016
11
2 058 
1
1 391 
2015
7
2 532 
1
1 860 
2014
12
2 292 
1
1 400 

Analysis

Structure of prices per m²

Values of price percentiles per m² over the periods used for the estimated price of each type of property.

Structure of transaction amounts

Values of transaction amounts percentiles over the periods used for the estimated price of each type of property.

Transaction amounts and prices per m² by percentile

Ascending order
Percentile
Houses
house
Price per m²
Houses
house
Transaction amount
Apartments
apt.
Price per m²
Apartments
apt.
Transaction amount
10th percentile
1 248 
78 500 
744 
81 800 
20th percentile
1 739 
156 K
806 
87 600 
30th percentile
1 990 
184 K
981 
99 900 
40th percentile
2 283 
222 K
1 200 
119 K
50th percentile
2 470 
233 K
1 315 
130 K
60th percentile
2 702 
263 K
1 370 
138 K
70th percentile
2 886 
274 K
1 544 
164 K
80th percentile
3 029 
290 K
1 823 
203 K
90th percentile
3 869 
315 K
1 929 
240 K

National and departmental comparison

Evolution of the median price per m² of houses

Evolution of the median price per m² of apartments

Quarterly evolution

Evolution of the median price per m²

Evolution of the number of transactions

Quarterly data

Descending order
Quarter
Houses
house
transactions
Houses
house
Price per m²
Apartments
apt.
transactions
Apartments
apt.
Price per m²
2025 Q2
1
2 470 
0
--- 
2025 Q1
3
2 158 
0
--- 
2024 Q4
1
1 748 
0
--- 
2024 Q3
1
3 017 
0
--- 
2024 Q2
2
2 872 
0
--- 
2023 Q4
3
1 705 
0
--- 
2023 Q3
1
3 076 
0
--- 
2023 Q2
1
4 453 
0
--- 
2023 Q1
3
2 561 
0
--- 
2022 Q4
5
2 317 
1
1 050 
2022 Q3
4
2 056 
1
1 300 
2022 Q2
4
3 168 
1
2 458 
2022 Q1
5
2 221 
1
1 870 
2021 Q4
2
2 708 
1
677 
2021 Q3
1
1 600 
1
752 
2021 Q2
2
2 494 
0
--- 
2021 Q1
2
1 736 
0
--- 
2020 Q4
2
1 844 
0
--- 
2020 Q3
3
2 900 
0
--- 
2020 Q2
2
2 208 
1
1 429 
2020 Q1
4
2 172 
0
--- 
2019 Q4
1
2 701 
2
1 570 
2019 Q3
3
2 673 
1
819 
2019 Q2
3
1 670 
1
1 085 
2019 Q1
3
1 745 
0
--- 
2018 Q4
1
1 096 
0
--- 
2018 Q3
3
1 973 
1
2 023 
2018 Q2
1
2 357 
0
--- 
2018 Q1
2
2 008 
1
1 250 
2017 Q4
2
2 266 
0
--- 
2017 Q3
3
2 286 
0
--- 
2017 Q2
1
2 394 
0
--- 
2017 Q1
3
1 918 
2
1 054 
2016 Q4
1
2 625 
0
--- 
2016 Q3
3
1 902 
1
1 391 
2016 Q2
5
2 390 
0
--- 
2016 Q1
2
1 898 
0
--- 
2015 Q4
2
1 590 
1
1 860 
2015 Q3
2
2 232 
0
--- 
2015 Q1
3
2 532 
0
--- 
2014 Q4
2
2 536 
0
--- 
2014 Q3
6
1 852 
1
1 400 
2014 Q2
1
1 806 
0
--- 
2014 Q1
3
3 036 
0
--- 

Overview of the latest real estate transactions

The following list is an anonymized overview of the latest transactions. For more details and to find all transactions, please use the map to view transactions by plot or the transaction search page for a search by criteria.

2025-04-09
129 500 
Sale
Land
1005 m2
-Sols
2025-04-01
261 850 
2 470  /m²(106 m²)
Sale
Houses
House
3 rooms
106 m2
1 outbuilding
Land
250 m2
-Sols
2025-03-31
207 845 
Sale
Land
655 m2
-Sols
Land
3954 m2
-Terres
Land
20519 m2
-Terres
Land
9622 m2
-Terres
Land
9622 m2
-Terres
2025-03-31
17 949 
Sale
Land
5940 m2
-Terres
Land
13360 m2
-Terres
2025-03-28
287 000 
2 158  /m²(133 m²)
Sale
Houses
House
6 rooms
133 m2
2 outbuildings
Land
380 m2
-Sols
Land
610 m2
-Landes
2025-03-18
99 000 
Sale
Land
419 m2
-Terrains à bâtir
2025-03-04
160 000 
3 200  /m²(50 m²)
Sale
Houses
House
3 rooms
50 m2
Land
725 m2
-Sols
Land
705 m2
-Landes
2025-02-05
162 100 
1 621  /m²(100 m²)
Sale
Houses
House
5 rooms
100 m2
Land
82 m2
-Sols
2025-01-31
7 556 
Sale
Land
1120 m2
-Terres
Land
6396 m2
-Terres
2024-12-23
1 0
Sale
Commercial property
405 m2
Land
1089 m2
-Sols
2024-12-10
275 000 
331  /m²(830 m²)
Sale
Commercial property
830 m2
Land
730 m2
-Sols
Land
234 m2
-Sols
2024-11-28
150 000 
102  /m²(1465 m²)
Sale
Commercial property
1465 m2
Land
1615 m2
-Sols
Land
760 m2
-Landes
2024-11-28
5 878 
Sale
Land
5390 m2
-Terres
Land
1290 m2
-Terres
2024-11-16
360 000 
1 748  /m²(206 m²)
Sale
1 outbuilding
Land
4874 m2
-Terres
Houses
House
8 rooms
206 m2
Land
820 m2
-Sols
Land
1920 m2
-Landes
Land
4735 m2
-Terres
Land
2453 m2
-Landes
Land
12235 m2
-Terres
Land
2140 m2
-Landes
2024-10-29
4 910 
Sale
Land
5010 m2
-Terres
2024-10-24
40 740 
Sale
Land
970 m2
-Terrains à bâtir
2024-10-22
10 550 
Sale
Land
5345 m2
-Terres
Land
5345 m2
-Terres
Land
76 m2
-Eaux
/CANAL
2024-09-21
105 000 
Sale
Land
443 m2
-Terrains à bâtir
2024-08-27
401 372 
2 361  /m²(170 m²)
Sale
Commercial property
170 m2
Land
3037 m2
-Sols
2024-08-23
362 000 
3 017  /m²(120 m²)
Sale
Houses
House
4 rooms
120 m2
1 outbuilding
Land
633 m2
-Sols
232 transactions listed in the municipality

Alpes-de-Haute-Provence (04)

Most expensive cities

City
name
Descending orderHouses
house
Price per m²
4 318 
3 484 
3 440 
3 310 
3 174 
City
name
Descending orderApartments
apt.
Price per m²
100 000 
3 360 
3 063 
2 803 
2 734 
2 638 
2 558 

Least expensive cities

City
name
Ascending orderHouses
house
Price per m²
570 
600 
1 032 
1 096 
1 167 
1 202 
1 207 
City
name
Ascending orderApartments
apt.
Price per m²
132 
379 
489 
543 
592 
625 
668 
679