emooki
HomePrice mapTransactions
🇬🇧 English🇫🇷 Français🇩🇪 Deutsch🇪🇸 Español🇮🇹 Italiano

Real estate price map


Real estate price map in the municipality of Villieu-Loyes-Mollon, choose a section to see transactions by parcel.

Ain (01)

Villieu-Loyes-Mollon - Real estate price m²

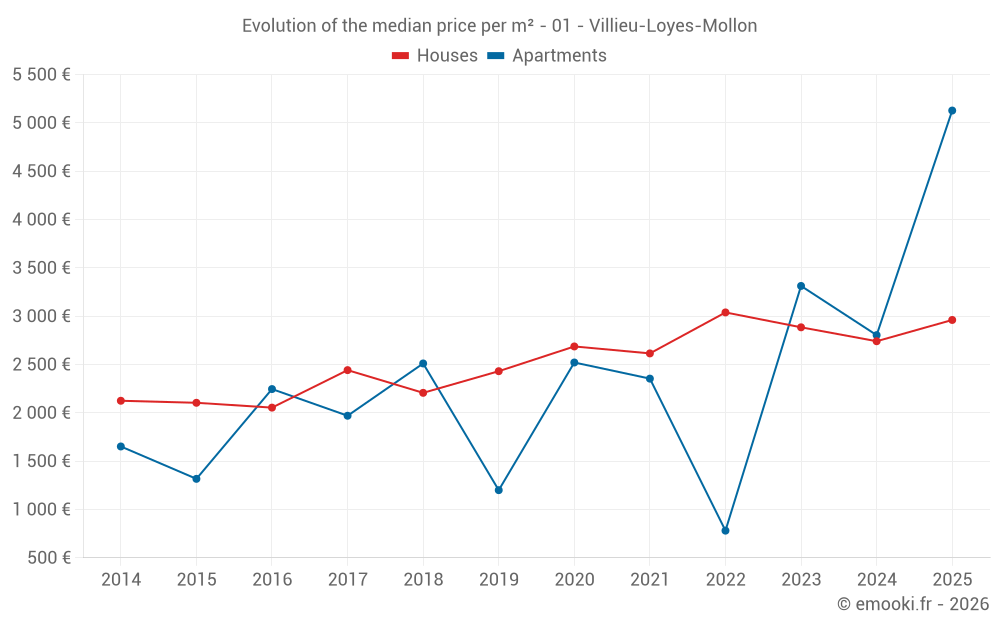
Median price of real estate
in the municipality of Villieu-Loyes-Mollon

HousesHouses
2 774  /m²
1-23-45-67-89-10
Reliability 8/10
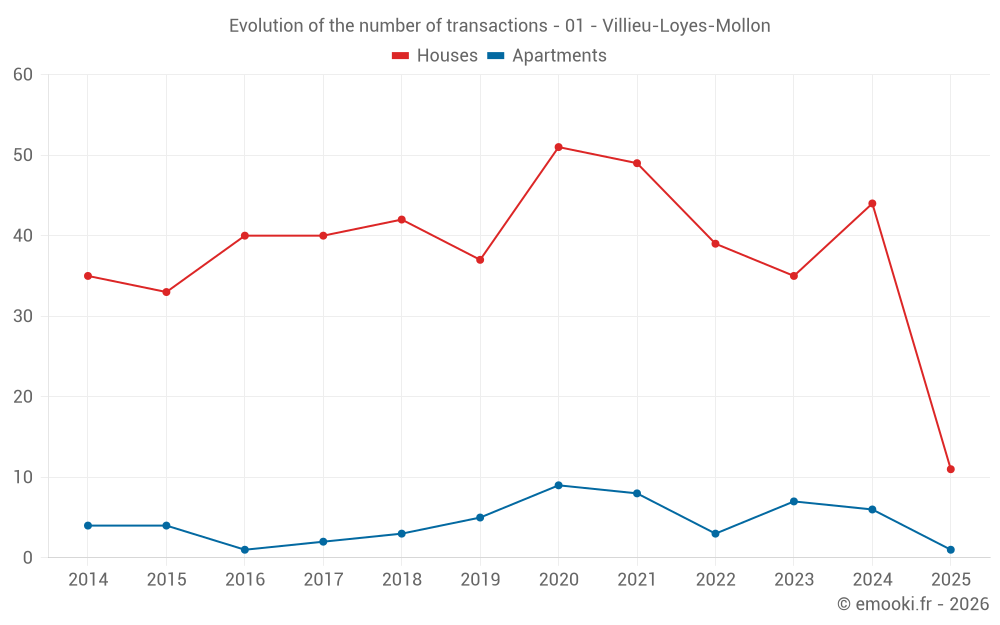
Median price on the 44 transactions of the last 12 months.
from 1 999 to
3 340  /m²
60% of transactions from the 2nd to the 8th deciles.
ApartmentsApartments
2 804  /m²
1-23-45-67-89-10
Reliability 6/10
Median price on the 16 transactions of the last 36 months.
from 2 444 to
3 871  /m²
60% of transactions from the 2nd to the 8th deciles.
DwellingsDwellings
2 774  /m²
1-23-45-67-89-10
Reliability 8/10
Median price on the 46 transactions of the last 12 months.
from 2 036 to
3 351  /m²
60% of transactions from the 2nd to the 8th deciles.
HousesEvolution of the price per m² of houses since...
1 year
+8%
2 years
+2.6%
3 years
-2.6%
4 years
+13%
5 years
+10%
6 years
+22%
7 years
+34%
8 years
+21%
9 years
+44%
10 years
+41%
11 years
+39%
The price per m² of houses has decreased by 2.6% since 3 years, but it has increased by 44% in 9 years.

Yearly evolution

Evolution of the median price per m²

Evolution of the median price per m² - 01 - Villieu-Loyes-Mollon

Evolution of the number of transactions

Warning, last year incomplete. Projections made based on the proportions between semesters of the previous year at the departmental/national level and by type of property.

Evolution of the number of transactions - 01 - Villieu-Loyes-Mollon

Yearly data

Descending order
Year
Houses
house
transactions
Houses
house
Price per m²
Apartments
apt.
transactions
Apartments
apt.
Price per m²
2025
11
2 961 
1
5 128 
2024
44
2 741 
6
2 804 
2023
35
2 885 
7
3 313 
2022
39
3 039 
3
781 
2021
49
2 615 
8
2 354 
2020
51
2 687 
9
2 521 
2019
37
2 431 
5
1 200 
2018
42
2 207 
3
2 511 
2017
40
2 442 
2
1 970 
2016
40
2 054 
1
2 246 
2015
33
2 104 
4
1 317 
2014
35
2 125 
4
1 652 

Analysis

Structure of prices per m²

Values of price percentiles per m² over the periods used for the estimated price of each type of property.

Structure of transaction amounts

Values of transaction amounts percentiles over the periods used for the estimated price of each type of property.

Transaction amounts and prices per m² by percentile

Ascending order
Percentile
Houses
house
Price per m²
Houses
house
Transaction amount
Apartments
apt.
Price per m²
Apartments
apt.
Transaction amount
10th percentile
1 658 
159 K
1 700 
139 K
20th percentile
1 999 
185 K
2 444 
161 K
30th percentile
2 407 
232 K
2 587 
183 K
40th percentile
2 694 
254 K
2 793 
186 K
50th percentile
2 774 
284 K
2 804 
190 K
60th percentile
3 072 
294 K
2 814 
203 K
70th percentile
3 161 
300 K
3 130 
234 K
80th percentile
3 340 
321 K
3 871 
237 K
90th percentile
3 613 
385 K
3 958 
358 K

National and departmental comparison

Evolution of the median price per m² of houses

Evolution of the median price per m² of apartments

Quarterly evolution

Evolution of the median price per m²

Evolution of the number of transactions

Quarterly data

Descending order
Quarter
Houses
house
transactions
Houses
house
Price per m²
Apartments
apt.
transactions
Apartments
apt.
Price per m²
2025 Q2
8
2 957 
0
--- 
2025 Q1
3
3 152 
1
5 128 
2024 Q4
14
2 698 
1
2 584 
2024 Q3
19
2 775 
0
--- 
2024 Q2
4
2 674 
4
2 804 
2024 Q1
7
3 138 
1
2 946 
2023 Q4
6
2 588 
3
3 927 
2023 Q3
11
2 885 
1
2 444 
2023 Q2
10
3 020 
2
1 700 
2023 Q1
8
3 311 
1
3 871 
2022 Q4
10
3 546 
0
--- 
2022 Q3
15
2 785 
2
1 642 
2022 Q2
8
3 310 
0
--- 
2022 Q1
6
2 570 
1
781 
2021 Q4
13
2 530 
4
2 185 
2021 Q3
9
3 110 
1
2 410 
2021 Q2
15
2 886 
3
2 516 
2021 Q1
12
2 543 
0
--- 
2020 Q4
16
2 792 
2
2 844 
2020 Q3
14
2 440 
5
2 515 
2020 Q2
12
2 834 
1
3 023 
2020 Q1
9
2 819 
1
1 188 
2019 Q4
12
2 388 
1
2 192 
2019 Q3
12
2 515 
1
2 852 
2019 Q2
6
2 653 
1
1 200 
2019 Q1
7
2 115 
2
480 
2018 Q4
17
2 155 
0
--- 
2018 Q3
9
2 552 
1
1 710 
2018 Q2
9
2 278 
1
2 511 
2018 Q1
7
2 023 
1
2 659 
2017 Q4
9
2 524 
0
--- 
2017 Q3
9
2 589 
1
2 194 
2017 Q2
12
2 164 
1
1 746 
2017 Q1
10
2 364 
0
--- 
2016 Q4
11
1 990 
1
2 246 
2016 Q3
12
2 089 
0
--- 
2016 Q2
13
1 780 
0
--- 
2016 Q1
4
1 480 
0
--- 
2015 Q4
8
2 137 
2
1 236 
2015 Q3
14
1 740 
1
1 272 
2015 Q2
5
2 631 
1
1 391 
2015 Q1
6
1 720 
0
--- 
2014 Q4
6
1 966 
1
1 304 
2014 Q3
15
2 118 
2
1 591 
2014 Q2
9
2 125 
0
--- 
2014 Q1
5
2 389 
1
2 269 

Overview of the latest real estate transactions

The following list is an anonymized overview of the latest transactions. For more details and to find all transactions, please use the map to view transactions by plot or the transaction search page for a search by criteria.

2025-06-02
10 000 
Sale
Land
20 m2
-Taillis sous futaie
Land
1517 m2
-Taillis sous futaie
Land
1482 m2
-Prés
Land
1117 m2
-Prés
2025-05-26
24 000 
Sale
Land
29180 m2
-Terres
Land
3450 m2
-Terres
Land
3560 m2
-Taillis sous futaie
Land
9920 m2
-Terres
Land
8940 m2
-Terres
2025-05-19
1 015 
Sale
Land
203 m2
-Terres
2025-05-19
1 915 
Sale
Land
383 m2
-Terres
2025-05-19
840 
Sale
Land
63 m2
-Terres
2025-05-19
510 
Sale
Land
91 m2
-Prés
Land
11 m2
-Terres
2025-05-19
120 
Sale
Land
24 m2
-Terres
2025-05-15
450 000 
2 961  /m²(152 m²)
Sale
Houses
House
5 rooms
152 m2
Land
5270 m2
-Sols
Land
5920 m2
-Sols
2025-05-14
265 000 
2 409  /m²(110 m²)
Sale
Houses
House
5 rooms
110 m2
1 outbuilding
Land
277 m2
-Sols
Land
489 m2
-Sols
Land
155 m2
-Terrains d'agrément
2025-05-06
330 000 
3 667  /m²(90 m²)
Sale
Houses
House
4 rooms
90 m2
2 outbuildings
Land
2225 m2
-Terrains d'agrément
Land
1000 m2
-Sols
2025-04-30
380 000 
3 619  /m²(105 m²)
Sale
Houses
House
4 rooms
105 m2
Land
500 m2
-Sols
Land
723 m2
-Terrains d'agrément
2025-04-28
290 000 
3 333  /m²(87 m²)
Sale
Houses
House
4 rooms
87 m2
1 outbuilding
Land
513 m2
-Sols
2025-04-23
290 000 
2 117  /m²(137 m²)
Sale
Houses
House
4 rooms
137 m2
1 outbuilding
Land
500 m2
-Sols
Land
800 m2
-Terrains d'agrément
2025-04-11
505 000 
2 953  /m²(171 m²)
Sale
Houses
House
5 rooms
171 m2
1 outbuilding
Land
666 m2
-Sols
2025-04-07
155 000 
1 054  /m²(147 m²)
1 550  /m²(100 m²)
Sale
Houses
House
4 rooms
100 m2
Commercial property
47 m2
Land
240 m2
-Sols
2025-04-07
380 000 
2 774  /m²(137 m²)
Sale
Houses
House
6 rooms
137 m2
1 outbuilding
Land
693 m2
-Sols
Land
281 m2
-Sols
2025-03-17
1 000 000 
5 128  /m²(195 m²)
Sale
Apartments
Apartment
3 rooms
54 m2
Apartments
Apartment
6 rooms
141 m2
8 outbuildings
Land
710 m2
-Sols
1 outbuilding
Land
105 m2
-Sols
Land
500 m2
-Prés
Land
200 m2
-Sols
Land
500 m2
-Prés
Land
2795 m2
-Prés
Land
3650 m2
-Terrains d'agrément
Land
1125 m2
-Terrains d'agrément
Land
500 m2
-Sols
Land
635 m2
-Prés
Land
610 m2
-Jardins
2025-02-20
2 500 
Sale
Land
39 m2
-Sols
Land
409 m2
-Sols
Land
1 m2
-Sols
Land
64 m2
-Sols
Land
3 m2
-Sols
2025-02-20
163 000 
Sale
Land
1002 m2
-Sols
2025-01-27
144 000 
1 600  /m²(90 m²)
Sale
Houses
House
3 rooms
90 m2
Land
672 m2
-Sols
Land
43 m2
-Sols
885 transactions listed in the municipality

Ain (01)

Most expensive cities

City
name
Descending orderHouses
house
Price per m²
5 676 
5 576 
5 534 
5 509 
5 248 
5 159 
5 146 
City
name
Descending orderApartments
apt.
Price per m²
5 372 
5 062 
5 000 
4 942 
4 889 
4 836 
4 787 
4 691 

Least expensive cities

City
name
Ascending orderHouses
house
Price per m²
797 
808 
816 
893 
927 
958 
1 034 
1 046 
City
name
Ascending orderApartments
apt.
Price per m²
157 
174 
185 
217 
336 
349 
380 
421 
444