emooki

Real estate price map


Real estate price map in the municipality of Saint-Trivier-de-Courtes, choose a section to see transactions by parcel.

Ain (01)

Price per m² in Saint-Trivier-de-Courtes

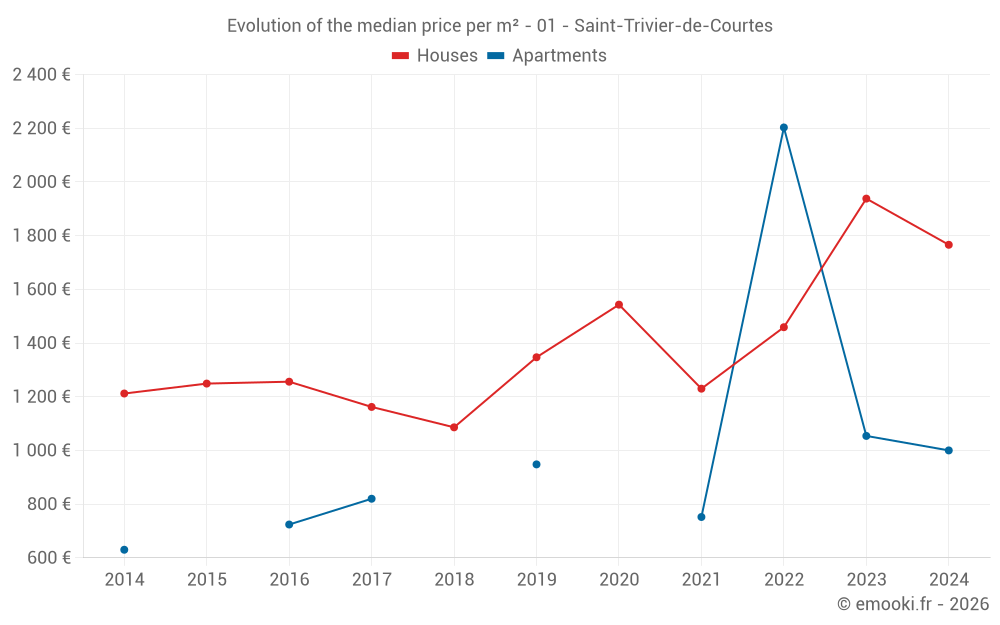
Median price of real estate
in the municipality of Saint-Trivier-de-Courtes

HousesHouses
1 844  /m²
1-23-45-67-89-10
Reliability 7/10
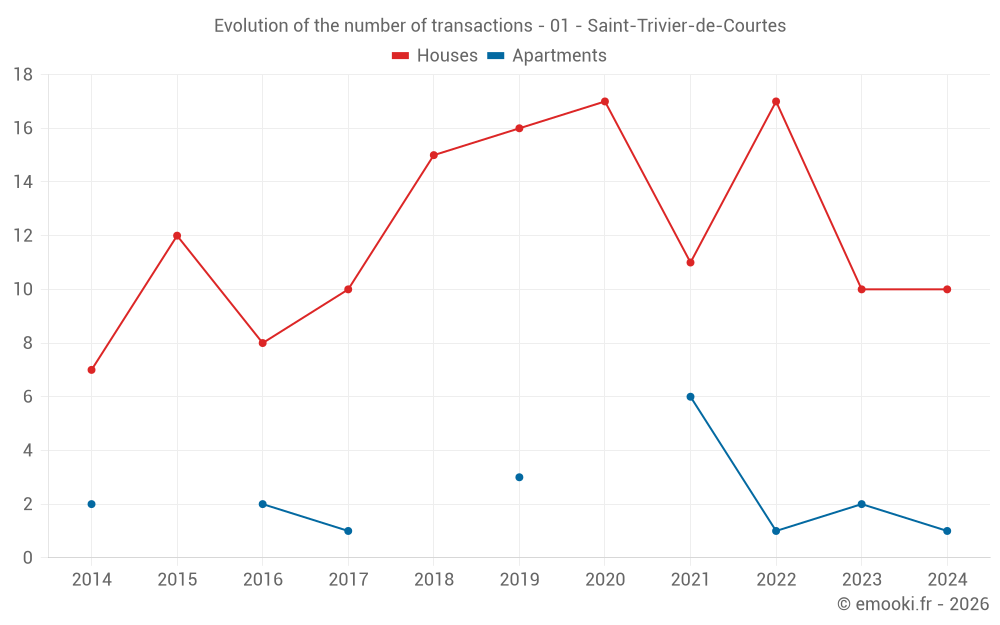
Median price on the 15 transactions of the last 24 months.
from 1 555 to
2 101  /m²
60% of transactions from the 2nd to the 8th deciles.
ApartmentsApartments
952  /m²
1-23-45-67-89-10
Reliability 4/10
Median price on the 10 transactions of the last 60 months.
DwellingsDwellings
1 811  /m²
1-23-45-67-89-10
Reliability 7/10
Median price on the 16 transactions of the last 24 months.
from 1 108 to
2 096  /m²
60% of transactions from the 2nd to the 8th deciles.

324 transactions listed in the municipality

Yearly data

Yearly evolution of the median price per m²

Yearly evolution of the median price per m² - 01 - Saint-Trivier-de-Courtes

Yearly evolution of the number of transactions

Warning, last year incomplete. Projections made based on the proportions between semesters of the previous year at the departmental/national level and by type of property.

Yearly evolution of the number of transactions - 01 - Saint-Trivier-de-Courtes

Yearly table

Descending order
Year
Houses
house
transactions
Houses
house
Price per m²
Apartments
apt.
transactions
Apartments
apt.
Price per m²
2025
0
--- 
0
--- 
2024
10
1 766 
1
1 000 
2023
10
1 938 
2
1 054 
2022
17
1 459 
1
2 203 
2021
11
1 230 
6
752 
2020
17
1 543 
0
--- 
2019
16
1 347 
3
948 
2018
15
1 086 
0
--- 
2017
10
1 162 
1
820 
2016
8
1 256 
2
724 
2015
12
1 249 
0
--- 
2014
7
1 212 
2
630 

Analysis

Structure of prices per m²

Values of price percentiles per m² over the periods used for the estimated price of each type of property.

Structure of transaction amounts

Values of transaction amounts percentiles over the periods used for the estimated price of each type of property.

Transaction amounts and prices per m² by percentile

Ascending order
Percentile
Houses
house
Price per m²
Houses
house
Transaction amount
Apartments
apt.
Price per m²
Apartments
apt.
Transaction amount
10th percentile
652 
59 800 
519 
67 368 
20th percentile
1 555 
92 600 
584 
86 000 
30th percentile
1 696 
122 K
605 
98 400 
40th percentile
1 769 
163 K
785 
104 K
50th percentile
1 844 
180 K
952 
112 K
60th percentile
1 906 
187 K
1 099 
136 K
70th percentile
2 018 
198 K
1 257 
162 K
80th percentile
2 101 
225 K
1 322 
166 K
90th percentile
2 456 
235 K
1 570 
180 K

National and departmental comparison

Evolution of the median price per m² of houses

Evolution of the median price per m² of apartments

Quarterly data

Quarterly evolution of the median price per m²

Quarterly evolution of the number of transactions

Quarterly table

Descending order
Quarter
Houses
house
transactions
Houses
house
Price per m²
Apartments
apt.
transactions
Apartments
apt.
Price per m²
2024 Q4
6
1 878 
0
--- 
2024 Q2
2
1 811 
0
--- 
2024 Q1
2
886 
1
1 000 
2023 Q4
2
1 185 
0
--- 
2023 Q3
3
2 096 
0
--- 
2023 Q2
5
1 905 
1
607 
2023 Q1
0
--- 
1
1 500 
2022 Q4
1
1 628 
1
2 203 
2022 Q3
9
1 459 
0
--- 
2022 Q2
4
1 602 
0
--- 
2022 Q1
3
580 
0
--- 
2021 Q4
1
1 832 
2
1 076 
2021 Q3
3
1 496 
2
504 
2021 Q2
4
1 480 
2
938 
2021 Q1
3
301 
0
--- 
2020 Q4
8
1 629 
0
--- 
2020 Q3
4
1 386 
0
--- 
2020 Q2
4
1 359 
0
--- 
2020 Q1
1
1 219 
0
--- 
2019 Q4
10
1 581 
1
948 
2019 Q3
3
402 
2
792 
2019 Q2
2
1 128 
0
--- 
2019 Q1
1
1 000 
0
--- 
2018 Q4
3
905 
0
--- 
2018 Q3
6
1 364 
0
--- 
2018 Q2
5
625 
0
--- 
2018 Q1
1
1 702 
0
--- 
2017 Q4
3
1 267 
1
820 
2017 Q3
2
1 645 
0
--- 
2017 Q2
2
962 
0
--- 
2017 Q1
3
787 
0
--- 
2016 Q4
1
1 453 
1
431 
2016 Q3
3
1 291 
0
--- 
2016 Q2
3
392 
1
1 016 
2016 Q1
1
2 283 
0
--- 
2015 Q4
5
1 400 
0
--- 
2015 Q3
3
1 403 
0
--- 
2015 Q2
1
1 144 
0
--- 
2015 Q1
3
1 019 
0
--- 
2014 Q4
4
1 281 
0
--- 
2014 Q2
2
932 
1
784 
2014 Q1
1
1 080 
1
475 

Key takeaways

  • QuestionWhat is the price per m2 of houses in Saint-Trivier-de-Courtes?

    The median price on the 15 house transactions of the last 24 months in the municipality of Saint-Trivier-de-Courtes was 1 844 € per square meter for a median property value of 180 000 €. Over this period, 60% of transactions were between 1 555 and 2 101 € per square meter (from the 2nd to the 8th deciles).

Compare with neighboring municipalities

City
name
Descending orderHouses
house
Price per m²
Apartments
apt.
Price per m²
1 918 
983 
1 844 
952 
1 768 
542 
1 767 
2 666 
1 678 
1 957 
1 623 
--- 
1 622 
--- 
1 483 
533 
1 320 
--- 
1 278 
356 

City information

Zip code

  • 01560 ST TRIVIER DE COURTES