emooki
HomePrice mapTransactions
🇬🇧 English🇫🇷 Français🇩🇪 Deutsch🇪🇸 Español🇮🇹 Italiano

Real estate price map


Real estate price map in the municipality of Port, choose a section to see transactions by parcel.

Ain (01)

Port - Real estate price m²

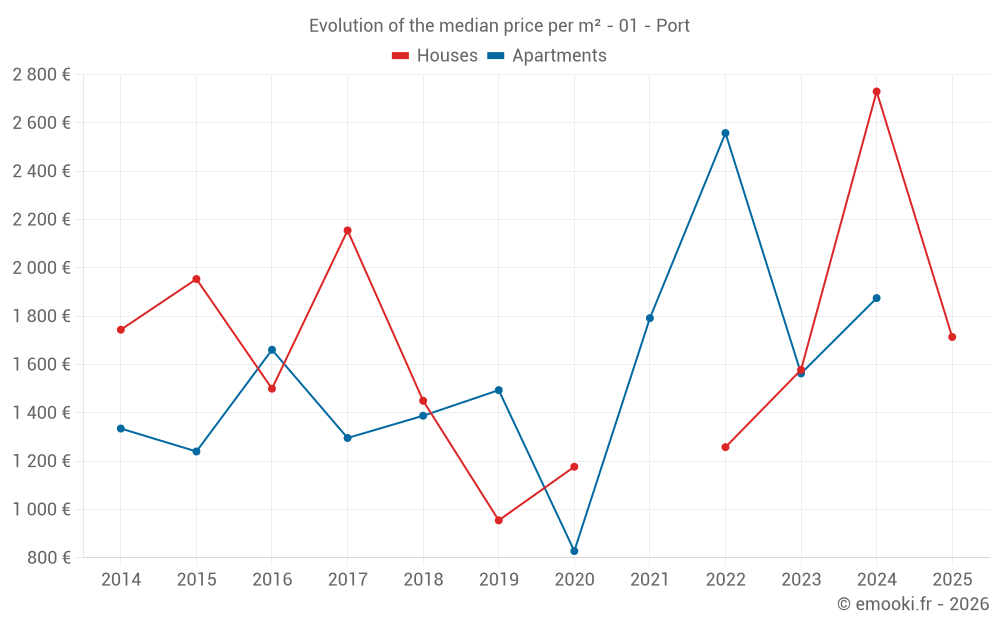
Median price of real estate
in the municipality of Port

HousesHouses
1 714  /m²
1-23-45-67-89-10
Reliability 6/10
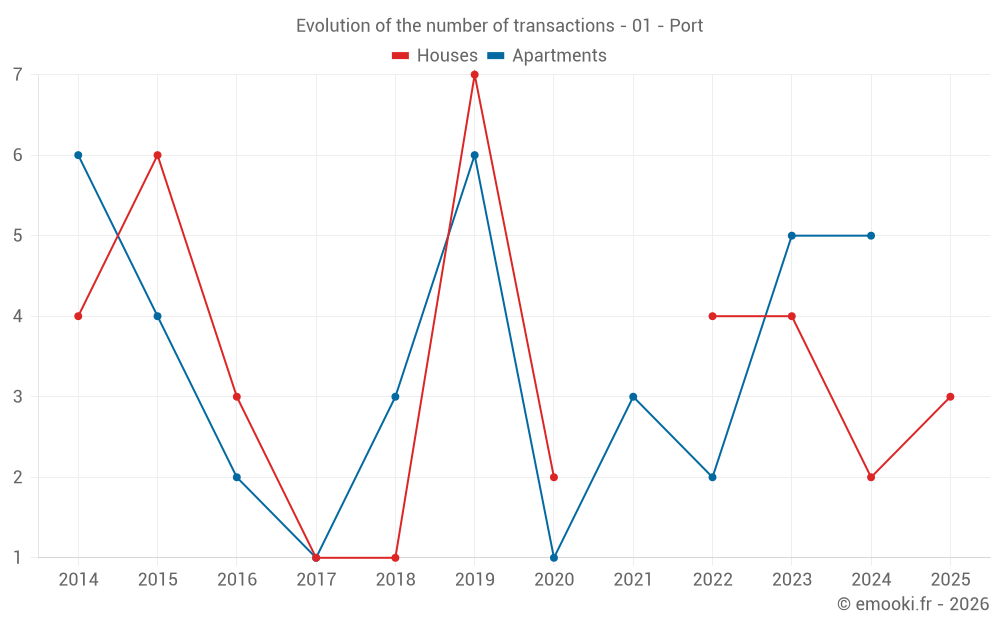
Median price on the 13 transactions of the last 36 months.
from 1 126 to
2 295  /m²
60% of transactions from the 2nd to the 8th deciles.
ApartmentsApartments
1 836  /m²
1-23-45-67-89-10
Reliability 5/10
Median price on the 14 transactions of the last 48 months.
from 1 484 to
2 198  /m²
60% of transactions from the 2nd to the 8th deciles.
DwellingsDwellings
1 875  /m²
1-23-45-67-89-10
Reliability 7/10
Median price on the 16 transactions of the last 24 months.
from 1 366 to
2 297  /m²
60% of transactions from the 2nd to the 8th deciles.

Yearly evolution

Evolution of the median price per m²

Evolution of the median price per m² - 01 - Port

Evolution of the number of transactions

Warning, last year incomplete. Projections made based on the proportions between semesters of the previous year at the departmental/national level and by type of property.

Evolution of the number of transactions - 01 - Port

Yearly data

Descending order
Year
Houses
house
transactions
Houses
house
Price per m²
Apartments
apt.
transactions
Apartments
apt.
Price per m²
2025
3
1 714 
0
--- 
2024
2
2 730 
5
1 875 
2023
4
1 578 
5
1 563 
2022
4
1 258 
2
2 558 
2021
0
--- 
3
1 792 
2020
2
1 177 
1
828 
2019
7
955 
6
1 494 
2018
1
1 450 
3
1 388 
2017
1
2 155 
1
1 296 
2016
3
1 500 
2
1 661 
2015
6
1 954 
4
1 240 
2014
4
1 744 
6
1 335 

Analysis

Structure of prices per m²

Values of price percentiles per m² over the periods used for the estimated price of each type of property.

Structure of transaction amounts

Values of transaction amounts percentiles over the periods used for the estimated price of each type of property.

Transaction amounts and prices per m² by percentile

Ascending order
Percentile
Houses
house
Price per m²
Houses
house
Transaction amount
Apartments
apt.
Price per m²
Apartments
apt.
Transaction amount
10th percentile
851 
78 400 
1 158 
45 000 
20th percentile
1 126 
102 K
1 484 
55 200 
30th percentile
1 260 
108 K
1 750 
73 700 
40th percentile
1 373 
118 K
1 793 
80 200 
50th percentile
1 714 
125 K
1 836 
96 500 
60th percentile
1 951 
200 K
1 875 
111 K
70th percentile
2 177 
244 K
1 906 
113 K
80th percentile
2 295 
268 K
2 198 
128 K
90th percentile
2 545 
344 K
2 369 
160 K

National and departmental comparison

Evolution of the median price per m² of houses

Evolution of the median price per m² of apartments

Quarterly evolution

Evolution of the median price per m²

Evolution of the number of transactions

Quarterly data

Descending order
Quarter
Houses
house
transactions
Houses
house
Price per m²
Apartments
apt.
transactions
Apartments
apt.
Price per m²
2025 Q2
2
1 650 
0
--- 
2025 Q1
1
1 714 
0
--- 
2024 Q4
0
--- 
2
2 086 
2024 Q3
1
3 250 
1
1 875 
2024 Q1
1
2 209 
2
1 700 
2023 Q4
1
525 
2
1 316 
2023 Q3
1
2 353 
2
1 749 
2023 Q2
0
--- 
1
1 771 
2023 Q1
2
1 698 
0
--- 
2022 Q4
3
1 250 
0
--- 
2022 Q3
1
1 266 
1
1 881 
2022 Q2
0
--- 
1
3 235 
2021 Q4
0
--- 
1
1 792 
2021 Q3
0
--- 
1
1 797 
2021 Q1
0
--- 
1
1 250 
2020 Q4
2
1 177 
0
--- 
2020 Q2
0
--- 
1
828 
2019 Q4
1
1 258 
2
1 720 
2019 Q3
1
955 
1
1 030 
2019 Q2
3
1 688 
0
--- 
2019 Q1
2
486 
3
1 531 
2018 Q4
0
--- 
1
1 288 
2018 Q3
0
--- 
1
1 388 
2018 Q1
1
1 450 
1
1 525 
2017 Q2
1
2 155 
1
1 296 
2016 Q4
1
1 500 
2
1 661 
2016 Q1
2
1 567 
0
--- 
2015 Q4
1
806 
0
--- 
2015 Q3
2
2 074 
2
1 266 
2015 Q2
0
--- 
1
1 417 
2015 Q1
3
1 907 
1
542 
2014 Q4
1
1 655 
0
--- 
2014 Q3
1
2 683 
2
1 060 
2014 Q2
2
1 386 
3
1 250 
2014 Q1
0
--- 
1
1 420 

Overview of the latest real estate transactions

The following list is an anonymized overview of the latest transactions. For more details and to find all transactions, please use the map to view transactions by plot or the transaction search page for a search by criteria.

2025-05-13
105 000 
1 400  /m²(75 m²)
Sale
Houses
House
4 rooms
75 m2
1 outbuilding
Land
344 m2
-Sols
Land
460 m2
-Chemin de fer
/Chemin de fer
2025-04-18
190 000 
1 900  /m²(100 m²)
Sale
Houses
House
3 rooms
100 m2
Land
199 m2
-Sols
Land
40 m2
-Sols
2025-01-16
120 000 
1 714  /m²(70 m²)
Sale
Houses
House
3 rooms
70 m2
Land
309 m2
-Sols
2024-12-16
900 000 
273  /m²(3296 m²)
25 000  /m²(36 m²)
Sale
Houses
House
2 rooms
36 m2
Commercial property
2040 m2
Land
3481 m2
-Sols
Commercial property
1220 m2
Land
1489 m2
-Sols
Land
496 m2
-Prés
Land
554 m2
-Prés
Land
1000 m2
-Prés
Land
2152 m2
-Prés
Land
789 m2
-Terrains à bâtir
2024-12-10
250 000 
630  /m²(397 m²)
Sale
Commercial property
397 m2
Land
463 m2
-Sols
Land
271 m2
-Sols
2024-11-29
960 
Sale
Land
3741 m2
-Terres
Land
1870 m2
-Terres
2024-11-27
45 000 
1 875  /m²(24 m²)
Sale
Apartments
Apartment
1 room
24 m2
1 outbuilding
2024-11-22
147 000 
2 297  /m²(64 m²)
Sale
1 outbuilding
Apartments
Apartment
3 rooms
64 m2
1 outbuilding
2024-08-28
45 000 
1 875  /m²(24 m²)
Sale
Apartments
Apartment
1 room
24 m2
1 outbuilding
2024-07-08
520 000 
3 250  /m²(160 m²)
Sale
Houses
House
4 rooms
160 m2
3 outbuildings
Land
5000 m2
-Prés
2024-06-06
55 000 
Sale
1 outbuilding
Land
277 m2
-Sols
2024-03-11
62 000 
1 000  /m²(62 m²)
Sale
Apartments
Apartment
1 room
31 m2
Apartments
Apartment
1 room
31 m2
2 outbuildings
2024-02-28
180 000 
2 400  /m²(75 m²)
Sale
Apartments
Apartment
3 rooms
75 m2
2 outbuildings
2024-02-19
360 000 
2 209  /m²(163 m²)
Sale
Houses
House
5 rooms
163 m2
Land
699 m2
-Sols
2023-12-29
75 000 
1 563  /m²(48 m²)
Sale
2 outbuildings
Apartments
Apartment
2 rooms
48 m2
1 outbuilding
2023-11-29
5 150 
Sale
Land
52 m2
-Sols
Land
154 m2
-Prés
2023-11-27
62 500 
525  /m²(119 m²)
Sale
Houses
House
5 rooms
119 m2
1 outbuilding
Land
449 m2
-Sols
Land
1500 m2
-Prés
Land
908 m2
-Jardins
2023-11-16
108 000 
1 069  /m²(101 m²)
Sale
Apartments
Apartment
2 rooms
50 m2
Apartments
Apartment
2 rooms
51 m2
3 outbuildings
2023-07-27
113 000 
2 132  /m²(53 m²)
Sale
Apartments
Apartment
2 rooms
53 m2
2 outbuildings
2023-07-27
112 000 
1 366  /m²(82 m²)
Sale
Apartments
Apartment
1 room
31 m2
Apartments
Apartment
2 rooms
51 m2
3 outbuildings
122 transactions listed in the municipality

Ain (01)

Most expensive cities

City
name
Descending orderHouses
house
Price per m²
5 676 
5 576 
5 534 
5 509 
5 248 
5 159 
5 146 
City
name
Descending orderApartments
apt.
Price per m²
5 372 
5 062 
5 000 
4 942 
4 889 
4 836 
4 787 
4 691 

Least expensive cities

City
name
Ascending orderHouses
house
Price per m²
797 
808 
816 
893 
927 
958 
1 034 
1 046 
City
name
Ascending orderApartments
apt.
Price per m²
157 
174 
185 
217 
336 
349 
380 
421 
444