emooki
HomePrice mapTransactions
🇬🇧 English🇫🇷 Français🇩🇪 Deutsch🇪🇸 Español🇮🇹 Italiano

Real estate price map


Real estate price map in the municipality of Massieux, choose a section to see transactions by parcel.

Ain (01)

Massieux - Real estate price m²

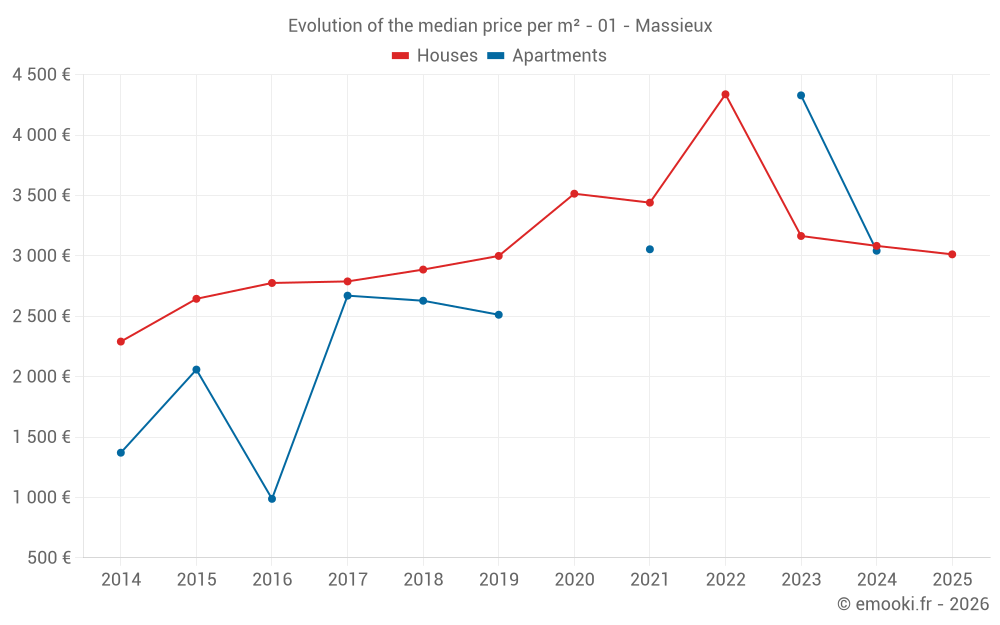
Median price of real estate
in the municipality of Massieux

HousesHouses
3 296  /m²
1-23-45-67-89-10
Reliability 8/10
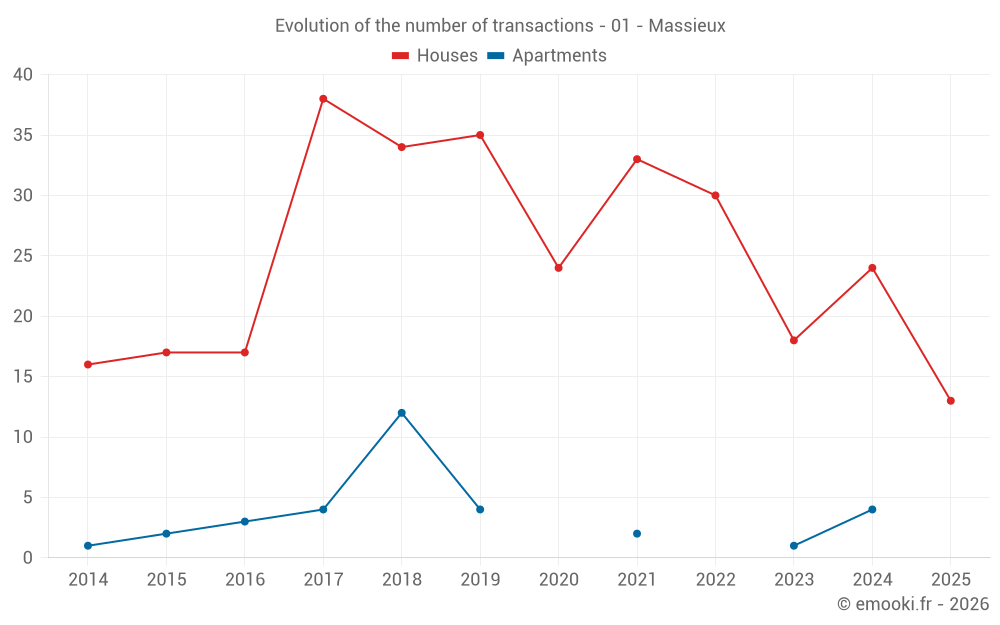
Median price on the 27 transactions of the last 12 months.
from 2 692 to
4 113  /m²
60% of transactions from the 2nd to the 8th deciles.
ApartmentsApartments
3 054  /m²
1-23-45-67-89-10
Reliability 3/10
Median price on the 8 transactions of the last 72 months.
DwellingsDwellings
3 639  /m²
1-23-45-67-89-10
Reliability 8/10
Median price on the 29 transactions of the last 12 months.
from 2 699 to
4 016  /m²
60% of transactions from the 2nd to the 8th deciles.
HousesEvolution of the price per m² of houses since...
1 year
-2.3%
2 years
-4.8%
3 years
-31%
4 years
-12%
5 years
-14%
6 years
+0.4%
7 years
+4.4%
8 years
+8%
9 years
+8.5%
10 years
+14%
11 years
+32%
The price per m² of houses has decreased by 31% since 3 years, but it has increased by 32% in 11 years.

Yearly evolution

Evolution of the median price per m²

Evolution of the median price per m² - 01 - Massieux

Evolution of the number of transactions

Warning, last year incomplete. Projections made based on the proportions between semesters of the previous year at the departmental/national level and by type of property.

Evolution of the number of transactions - 01 - Massieux

Yearly data

Descending order
Year
Houses
house
transactions
Houses
house
Price per m²
Apartments
apt.
transactions
Apartments
apt.
Price per m²
2025
13
3 012 
0
--- 
2024
24
3 082 
4
3 042 
2023
18
3 164 
1
4 328 
2022
30
4 337 
0
--- 
2021
33
3 440 
2
3 054 
2020
24
3 514 
0
--- 
2019
35
2 999 
4
2 512 
2018
34
2 886 
12
2 628 
2017
38
2 788 
4
2 670 
2016
17
2 775 
3
988 
2015
17
2 644 
2
2 058 
2014
16
2 290 
1
1 370 

Analysis

Structure of prices per m²

Values of price percentiles per m² over the periods used for the estimated price of each type of property.

Structure of transaction amounts

Values of transaction amounts percentiles over the periods used for the estimated price of each type of property.

Transaction amounts and prices per m² by percentile

Ascending order
Percentile
Houses
house
Price per m²
Houses
house
Transaction amount
Apartments
apt.
Price per m²
Apartments
apt.
Transaction amount
10th percentile
2 492 
196 K
1 198 
147 K
20th percentile
2 692 
263 K
1 783 
181 K
30th percentile
2 918 
286 K
2 469 
191 K
40th percentile
2 992 
322 K
2 641 
246 K
50th percentile
3 296 
354 K
3 054 
273 K
60th percentile
3 787 
379 K
3 462 
289 K
70th percentile
3 836 
396 K
3 617 
309 K
80th percentile
4 113 
448 K
3 742 
326 K
90th percentile
4 448 
461 K
3 966 
409 K

National and departmental comparison

Evolution of the median price per m² of houses

Evolution of the median price per m² of apartments

Quarterly evolution

Evolution of the median price per m²

Evolution of the number of transactions

Quarterly data

Descending order
Quarter
Houses
house
transactions
Houses
house
Price per m²
Apartments
apt.
transactions
Apartments
apt.
Price per m²
2025 Q2
6
3 420 
0
--- 
2025 Q1
7
2 763 
0
--- 
2024 Q4
3
3 782 
0
--- 
2024 Q3
11
3 659 
2
3 725 
2024 Q2
5
2 641 
1
2 444 
2024 Q1
5
3 014 
1
1 343 
2023 Q4
7
3 374 
1
4 328 
2023 Q3
6
1 889 
0
--- 
2023 Q2
2
3 680 
0
--- 
2023 Q1
3
2 953 
0
--- 
2022 Q4
6
4 319 
0
--- 
2022 Q3
9
4 686 
0
--- 
2022 Q2
10
3 412 
0
--- 
2022 Q1
5
4 635 
0
--- 
2021 Q4
7
3 531 
0
--- 
2021 Q3
11
3 741 
0
--- 
2021 Q2
10
3 322 
2
3 054 
2021 Q1
5
2 920 
0
--- 
2020 Q4
8
3 414 
0
--- 
2020 Q3
7
3 524 
0
--- 
2020 Q2
4
3 418 
0
--- 
2020 Q1
5
3 523 
0
--- 
2019 Q4
12
2 830 
1
860 
2019 Q3
14
2 828 
0
--- 
2019 Q2
2
3 633 
0
--- 
2019 Q1
7
3 068 
3
2 519 
2018 Q4
5
2 689 
0
--- 
2018 Q3
7
2 925 
2
2 667 
2018 Q2
14
3 124 
2
2 490 
2018 Q1
8
2 594 
8
2 628 
2017 Q4
7
2 513 
3
2 685 
2017 Q3
9
2 929 
0
--- 
2017 Q2
16
2 844 
0
--- 
2017 Q1
6
2 356 
1
2 509 
2016 Q4
3
2 775 
0
--- 
2016 Q3
5
3 157 
0
--- 
2016 Q2
5
2 494 
1
2 274 
2016 Q1
4
2 640 
2
668 
2015 Q4
3
2 529 
0
--- 
2015 Q3
8
2 512 
1
1 429 
2015 Q2
6
3 212 
1
2 688 
2014 Q3
6
2 839 
1
1 370 
2014 Q2
4
2 142 
0
--- 
2014 Q1
6
2 290 
0
--- 

Overview of the latest real estate transactions

The following list is an anonymized overview of the latest transactions. For more details and to find all transactions, please use the map to view transactions by plot or the transaction search page for a search by criteria.

2025-04-30
7 403 
Sale
Land
16450 m2
-Terres
2025-04-30
150 000 
2 308  /m²(65 m²)
Sale
Houses
House
3 rooms
65 m2
Land
398 m2
-Sols
2025-04-30
455 000 
4 417  /m²(103 m²)
Sale
Houses
House
5 rooms
103 m2
Land
258 m2
-Sols
Land
119 m2
-Sols
2025-04-25
395 000 
3 873  /m²(102 m²)
Sale
Houses
House
5 rooms
102 m2
Land
413 m2
-Sols
Land
131 m2
-Sols
2025-04-24
155 000 
Sale
Land
222 m2
-Sols
Land
1002 m2
-Landes
Land
654 m2
-Landes
Land
168 m2
-Sols
2025-04-23
310 000 
3 827  /m²(81 m²)
Sale
Houses
House
5 rooms
81 m2
1 outbuilding
Land
500 m2
-Sols
Land
1303 m2
-Terrains d'agrément
2025-04-17
275 000 
2 957  /m²(93 m²)
Sale
Houses
House
4 rooms
93 m2
2025-04-15
259 000 
3 012  /m²(86 m²)
Sale
Houses
House
4 rooms
86 m2
1 outbuilding
Land
788 m2
-Sols
2025-03-31
200 000 
Sale
Land
451 m2
-Sols
2025-03-24
291 790 
2 653  /m²(110 m²)
Sale
Houses
House
4 rooms
110 m2
Land
174 m2
-Sols
1 outbuilding
Land
25 m2
-Sols
2025-03-21
457 700 
4 161  /m²(110 m²)
Sale
Houses
House
4 rooms
110 m2
Land
457 m2
-Sols
2025-03-17
392 000 
5 158  /m²(76 m²)
Sale
Houses
House
3 rooms
76 m2
1 outbuilding
Land
405 m2
-Sols
Land
247 m2
-Sols
Land
451 m2
-Sols
2025-03-17
210 000 
2 763  /m²(76 m²)
Sale
Houses
House
3 rooms
76 m2
1 outbuilding
Land
405 m2
-Sols
2025-03-12
172 000 
Sale
Land
46 m2
-Terrains à bâtir
Land
440 m2
-Terrains à bâtir
2025-02-24
175 000 
2 244  /m²(78 m²)
Sale
Land
72 m2
-Sols
Houses
House
4 rooms
78 m2
Land
309 m2
-Sols
2025-02-24
135 000 
Sale
Land
466 m2
-Terrains à bâtir
2025-02-13
92 000 
1 415  /m²(65 m²)
Sale
Houses
House
3 rooms
65 m2
Land
424 m2
-Sols
2025-02-10
46 000 
Sale
Land
154 m2
-Sols
2025-01-07
378 050 
3 287  /m²(115 m²)
Sale
Houses
House
5 rooms
115 m2
Land
1065 m2
-Terrains d'agrément
Land
500 m2
-Sols
2024-12-23
1 
Sale
Land
32 m2
-Sols
548 transactions listed in the municipality

Ain (01)

Most expensive cities

City
name
Descending orderHouses
house
Price per m²
5 676 
5 576 
5 534 
5 509 
5 248 
5 159 
5 146 
City
name
Descending orderApartments
apt.
Price per m²
5 372 
5 062 
5 000 
4 942 
4 889 
4 836 
4 787 
4 691 

Least expensive cities

City
name
Ascending orderHouses
house
Price per m²
797 
808 
816 
893 
927 
958 
1 034 
1 046 
City
name
Ascending orderApartments
apt.
Price per m²
157 
174 
185 
217 
336 
349 
380 
421 
444