emooki
HomePrice mapTransactions
🇬🇧 English🇫🇷 Français🇩🇪 Deutsch🇪🇸 Español🇮🇹 Italiano

Real estate price map


Real estate price map in the municipality of Farges, choose a section to see transactions by parcel.

Ain (01)

Farges - Real estate price m²

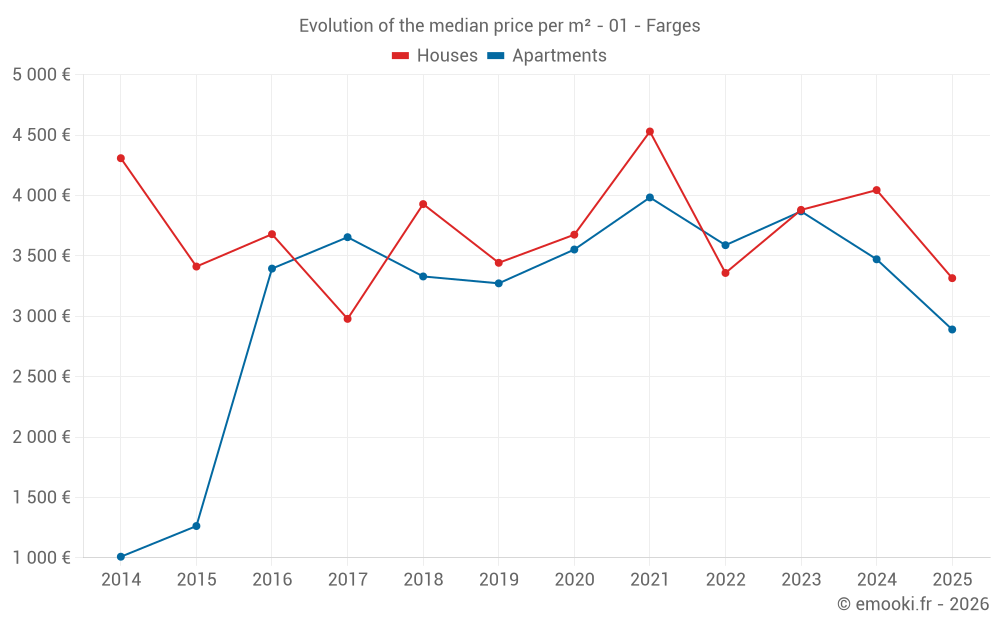
Median price of real estate
in the municipality of Farges

HousesHouses
4 216  /m²
1-23-45-67-89-10
Reliability 7/10
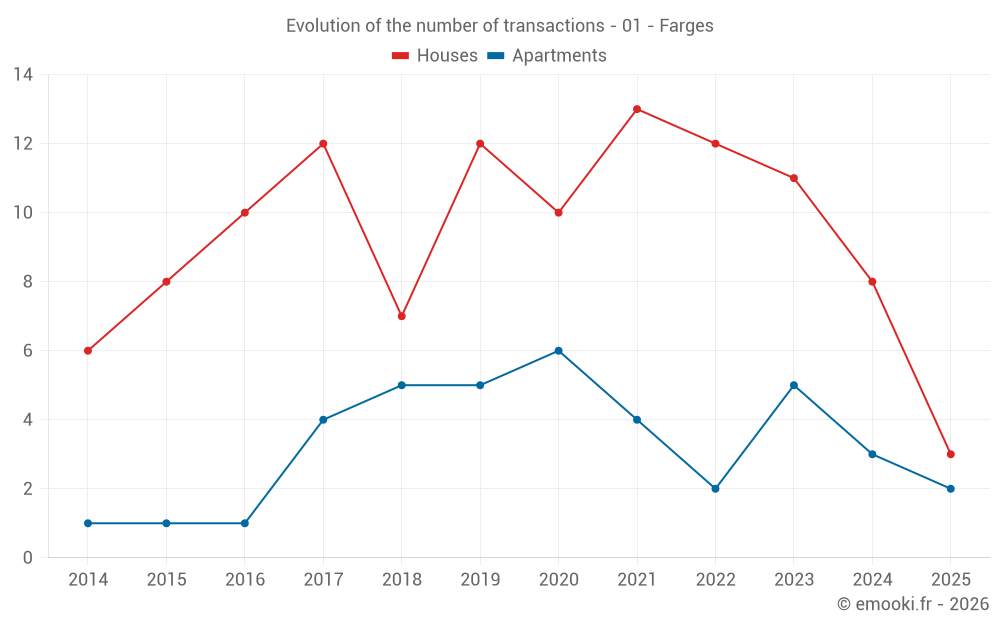
Median price on the 15 transactions of the last 24 months.
from 2 521 to
5 235  /m²
60% of transactions from the 2nd to the 8th deciles.
ApartmentsApartments
3 566  /m²
1-23-45-67-89-10
Reliability 6/10
Median price on the 12 transactions of the last 36 months.
from 3 239 to
3 905  /m²
60% of transactions from the 2nd to the 8th deciles.
DwellingsDwellings
3 566  /m²
1-23-45-67-89-10
Reliability 7/10
Median price on the 22 transactions of the last 24 months.
from 2 575 to
4 902  /m²
60% of transactions from the 2nd to the 8th deciles.

Yearly evolution

Evolution of the median price per m²

Evolution of the median price per m² - 01 - Farges

Evolution of the number of transactions

Warning, last year incomplete. Projections made based on the proportions between semesters of the previous year at the departmental/national level and by type of property.

Evolution of the number of transactions - 01 - Farges

Yearly data

Descending order
Year
Houses
house
transactions
Houses
house
Price per m²
Apartments
apt.
transactions
Apartments
apt.
Price per m²
2025
3
3 315 
2
2 890 
2024
8
4 044 
3
3 471 
2023
11
3 880 
5
3 868 
2022
12
3 358 
2
3 588 
2021
13
4 529 
4
3 983 
2020
10
3 675 
6
3 552 
2019
12
3 442 
5
3 272 
2018
7
3 928 
5
3 329 
2017
12
2 978 
4
3 654 
2016
10
3 679 
1
3 394 
2015
8
3 411 
1
1 263 
2014
6
4 308 
1
1 009 

Analysis

Structure of prices per m²

Values of price percentiles per m² over the periods used for the estimated price of each type of property.

Structure of transaction amounts

Values of transaction amounts percentiles over the periods used for the estimated price of each type of property.

Transaction amounts and prices per m² by percentile

Ascending order
Percentile
Houses
house
Price per m²
Houses
house
Transaction amount
Apartments
apt.
Price per m²
Apartments
apt.
Transaction amount
10th percentile
2 282 
286 K
2 783 
195 K
20th percentile
2 521 
363 K
3 239 
207 K
30th percentile
2 911 
371 K
3 324 
228 K
40th percentile
3 262 
396 K
3 499 
263 K
50th percentile
4 216 
444 K
3 566 
277 K
60th percentile
4 848 
463 K
3 697 
300 K
70th percentile
4 902 
470 K
3 838 
327 K
80th percentile
5 235 
580 K
3 905 
400 K
90th percentile
5 448 
606 K
4 067 
435 K

National and departmental comparison

Evolution of the median price per m² of houses

Evolution of the median price per m² of apartments

Quarterly evolution

Evolution of the median price per m²

Evolution of the number of transactions

Quarterly data

Descending order
Quarter
Houses
house
transactions
Houses
house
Price per m²
Apartments
apt.
transactions
Apartments
apt.
Price per m²
2025 Q2
1
3 315 
1
3 541 
2025 Q1
2
3 376 
1
2 240 
2024 Q4
2
3 534 
2
3 102 
2024 Q3
5
3 182 
0
--- 
2024 Q2
1
5 222 
0
--- 
2024 Q1
0
--- 
1
3 767 
2023 Q4
3
4 826 
1
3 868 
2023 Q3
1
4 880 
1
3 592 
2023 Q2
4
4 152 
3
4 084 
2023 Q1
3
3 667 
0
--- 
2022 Q4
3
3 527 
1
3 261 
2022 Q3
3
3 167 
1
3 914 
2022 Q2
3
1 649 
0
--- 
2022 Q1
3
3 294 
0
--- 
2021 Q4
1
4 516 
1
3 895 
2021 Q3
2
3 180 
1
4 140 
2021 Q2
8
4 763 
2
3 194 
2021 Q1
2
5 380 
0
--- 
2020 Q4
5
3 536 
0
--- 
2020 Q3
3
4 306 
1
3 795 
2020 Q2
1
2 040 
1
714 
2020 Q1
1
3 000 
4
3 590 
2019 Q4
2
3 232 
3
3 593 
2019 Q3
5
3 784 
1
3 272 
2019 Q2
2
4 152 
1
3 261 
2019 Q1
3
3 045 
0
--- 
2018 Q4
0
--- 
1
4 014 
2018 Q3
2
3 285 
0
--- 
2018 Q2
3
4 037 
4
3 261 
2018 Q1
2
3 796 
0
--- 
2017 Q4
2
2 902 
3
3 678 
2017 Q3
4
3 431 
1
3 629 
2017 Q2
4
3 072 
0
--- 
2017 Q1
2
2 778 
0
--- 
2016 Q4
3
3 606 
0
--- 
2016 Q3
1
4 000 
0
--- 
2016 Q2
3
3 969 
1
3 394 
2016 Q1
3
3 495 
0
--- 
2015 Q4
3
1 200 
0
--- 
2015 Q3
1
1 429 
1
1 263 
2015 Q2
1
3 987 
0
--- 
2015 Q1
3
4 179 
0
--- 
2014 Q4
2
4 103 
0
--- 
2014 Q3
2
4 308 
0
--- 
2014 Q1
2
3 208 
1
1 009 

Overview of the latest real estate transactions

The following list is an anonymized overview of the latest transactions. For more details and to find all transactions, please use the map to view transactions by plot or the transaction search page for a search by criteria.

2025-05-26
7 000 
Sale
Land
155 m2
-Prés
2025-05-19
216 000 
3 541  /m²(61 m²)
Sale
Apartments
Apartment
3 rooms
61 m2
2 outbuildings
2025-05-14
600 000 
3 315  /m²(181 m²)
Sale
Apartments
Apartment
2 rooms
60 m2
Houses
House
4 rooms
121 m2
1 outbuilding
Land
893 m2
-Sols
Land
107 m2
-Sols
2025-03-19
2 000 
Sale
Land
40 m2
-Terres
2025-02-28
280 000 
2 240  /m²(125 m²)
Sale
Apartments
Apartment
1 room
50 m2
Apartments
Apartment
3 rooms
75 m2
2 outbuildings
Land
85 m2
-Sols
Land
90 m2
-Jardins
Land
95 m2
-Jardins
2025-01-28
365 000 
2 535  /m²(144 m²)
Sale
Houses
House
6 rooms
144 m2
Land
266 m2
-Sols
Land
547 m2
-Jardins
2025-01-27
100 
Exchange
Land
10 m2
-Sols
Land
9 m2
-Sols
2025-01-07
468 000 
4 216  /m²(111 m²)
Sale
Houses
House
5 rooms
111 m2
1 outbuilding
Land
133 m2
-Sols
Land
78 m2
-Jardins
2024-12-19
392 550 
4 907  /m²(80 m²)
Sale
Houses
House
4 rooms
80 m2
1 outbuilding
2024-12-17
125 956 
Sale
Land
527 m2
-Terres
2024-12-17
123 088 
Sale
Land
513 m2
-Terres
2024-12-16
125 956 
Sale
Land
527 m2
-Terres
2024-12-16
20 160 
Sale
Land
1431 m2
-Terres
Land
585 m2
-Terres
2024-12-16
630 
Sale
Land
63 m2
-Jardins
2024-12-13
365 000 
2 160  /m²(169 m²)
Sale
Houses
House
6 rooms
169 m2
Land
128 m2
-Sols
Land
102 m2
-Jardins
2024-12-02
194 400 
3 471  /m²(56 m²)
Sale
Apartments
Apartment
2 rooms
56 m2
1 outbuilding
2024-11-04
205 000 
2 733  /m²(75 m²)
Sale
Apartments
Apartment
3 rooms
75 m2
3 outbuildings
2024-09-26
460 000 
5 287  /m²(87 m²)
Sale
Houses
House
4 rooms
87 m2
Land
298 m2
-Sols
Land
180 m2
-Terres
Land
127 m2
-Terrains à bâtir
2024-09-25
175 000 
3 182  /m²(55 m²)
Sale
Houses
House
2 rooms
55 m2
Land
285 m2
-Sols
Land
105 m2
-Jardins
2024-07-25
575 000 
5 867  /m²(98 m²)
Sale
Houses
House
5 rooms
98 m2
Land
904 m2
-Sols
314 transactions listed in the municipality

Ain (01)

Most expensive cities

City
name
Descending orderHouses
house
Price per m²
5 676 
5 576 
5 534 
5 509 
5 248 
5 159 
5 146 
City
name
Descending orderApartments
apt.
Price per m²
5 372 
5 062 
5 000 
4 942 
4 889 
4 836 
4 787 
4 691 

Least expensive cities

City
name
Ascending orderHouses
house
Price per m²
797 
808 
816 
893 
927 
958 
1 034 
1 046 
City
name
Ascending orderApartments
apt.
Price per m²
157 
174 
185 
217 
336 
349 
380 
421 
444