emooki
HomePrice mapTransactions
🇬🇧 English🇫🇷 Français🇩🇪 Deutsch🇪🇸 Español🇮🇹 Italiano

Real estate price map


Real estate price map in the municipality of Confrançon, choose a section to see transactions by parcel.

Ain (01)
Confrançon

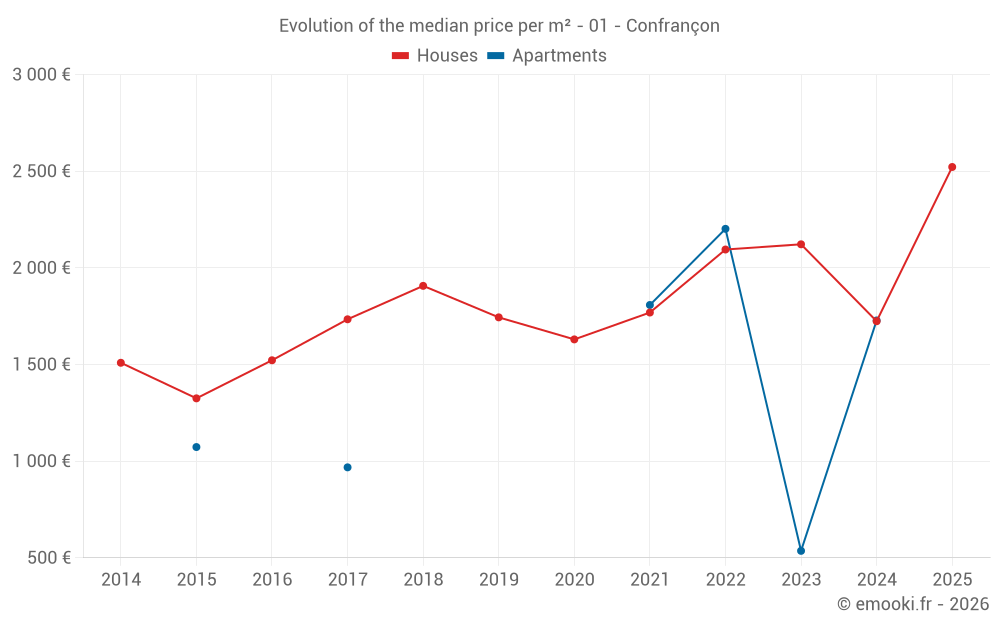
Median price of real estate
in the municipality of Confrançon

HousesHouses
2 146  /m²
1-23-45-67-89-10
Reliability 7/10
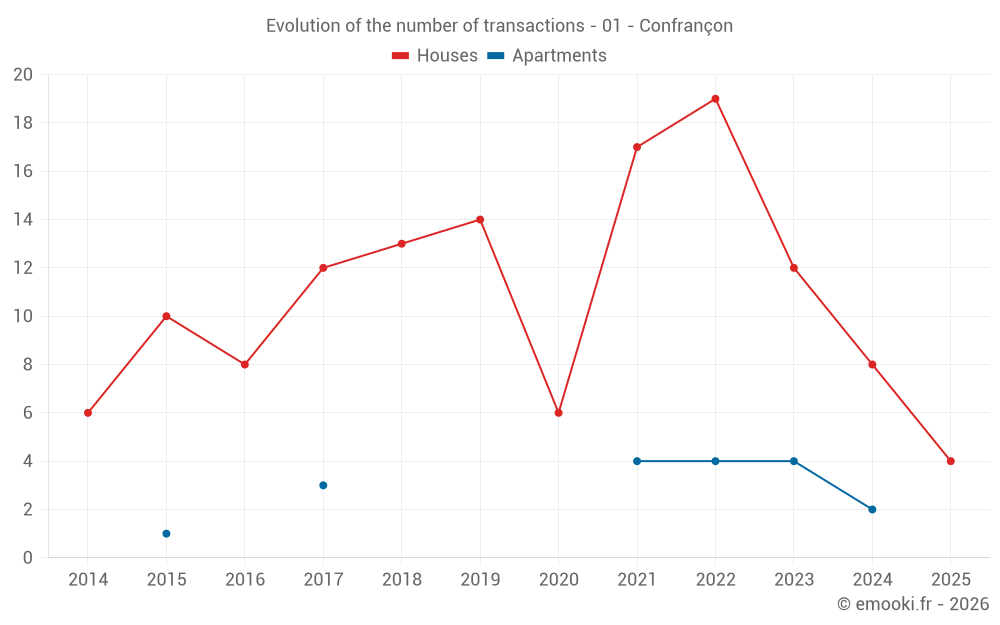
Median price on the 18 transactions of the last 24 months.
from 1 322 to
2 949  /m²
60% of transactions from the 2nd to the 8th deciles.
ApartmentsApartments
1 720  /m²
1-23-45-67-89-10
Reliability 5/10
Median price on the 13 transactions of the last 48 months.
from 817 to
2 211  /m²
60% of transactions from the 2nd to the 8th deciles.
DwellingsDwellings
2 010  /m²
1-23-45-67-89-10
Reliability 7/10
Median price on the 21 transactions of the last 24 months.
from 1 250 to
2 821  /m²
60% of transactions from the 2nd to the 8th deciles.
HousesEvolution of the price per m² of houses since...
1 year
+46%
2 years
+19%
3 years
+20%
4 years
+43%
5 years
+55%
6 years
+45%
7 years
+32%
8 years
+45%
9 years
+66%
10 years
+90%
11 years
+67%

Yearly evolution

Evolution of the median price per m²

Evolution of the number of transactions

Warning, last year incomplete. Projections made based on the proportions between semesters of the previous year at the departmental/national level and by type of property.

Yearly data

Descending order
Year
Houses
house
transactions
Houses
house
Price per m²
Apartments
apt.
transactions
Apartments
apt.
Price per m²
2025
4
2 522 
0
--- 
2024
8
1 724 
2
1 728 
2023
12
2 122 
4
536 
2022
19
2 095 
4
2 202 
2021
17
1 769 
4
1 808 
2020
6
1 630 
0
--- 
2019
14
1 744 
0
--- 
2018
13
1 907 
0
--- 
2017
12
1 734 
3
968 
2016
8
1 522 
0
--- 
2015
10
1 325 
1
1 073 
2014
6
1 509 
0
--- 

Analysis

Structure of prices per m²

Values of price percentiles per m² over the periods used for the estimated price of each type of property.

Structure of transaction amounts

Values of transaction amounts percentiles over the periods used for the estimated price of each type of property.

Transaction amounts and prices per m² by percentile

Ascending order
Percentile
Houses
house
Price per m²
Houses
house
Transaction amount
Apartments
apt.
Price per m²
Apartments
apt.
Transaction amount
10th percentile
1 104 
124 K
461 
90 200 
20th percentile
1 322 
130 K
817 
101 K
30th percentile
1 694 
147 K
1 074 
117 K
40th percentile
1 951 
181 K
1 484 
124 K
50th percentile
2 146 
227 K
1 720 
129 K
60th percentile
2 321 
291 K
1 933 
131 K
70th percentile
2 748 
330 K
2 174 
143 K
80th percentile
2 949 
370 K
2 211 
158 K
90th percentile
3 110 
399 K
2 303 
176 K

National and departmental comparison

Evolution of the median price per m² of houses

Evolution of the median price per m² of apartments

Quarterly evolution

Evolution of the median price per m²

Evolution of the number of transactions

Quarterly data

Descending order
Quarter
Houses
house
transactions
Houses
house
Price per m²
Apartments
apt.
transactions
Apartments
apt.
Price per m²
2025 Q2
2
3 148 
0
--- 
2025 Q1
2
2 142 
0
--- 
2024 Q4
2
1 517 
0
--- 
2024 Q3
3
3 074 
2
1 728 
2024 Q2
1
1 121 
0
--- 
2024 Q1
2
2 106 
0
--- 
2023 Q4
5
2 273 
0
--- 
2023 Q3
1
2 420 
1
282 
2023 Q2
4
1 582 
2
536 
2023 Q1
2
2 295 
1
2 328 
2022 Q4
3
1 790 
0
--- 
2022 Q3
6
2 441 
2
1 609 
2022 Q2
6
2 182 
1
2 232 
2022 Q1
4
1 848 
1
2 321 
2021 Q4
4
1 766 
2
1 950 
2021 Q3
5
1 520 
1
1 092 
2021 Q2
3
1 992 
1
1 897 
2021 Q1
5
1 880 
0
--- 
2020 Q4
1
1 927 
0
--- 
2020 Q3
4
1 292 
0
--- 
2020 Q2
1
2 291 
0
--- 
2019 Q4
7
1 806 
0
--- 
2019 Q3
3
1 905 
0
--- 
2019 Q2
2
1 934 
0
--- 
2019 Q1
2
1 314 
0
--- 
2018 Q4
4
1 700 
0
--- 
2018 Q3
1
1 116 
0
--- 
2018 Q2
3
2 107 
0
--- 
2018 Q1
5
1 722 
0
--- 
2017 Q4
3
1 603 
0
--- 
2017 Q3
3
1 771 
2
930 
2017 Q2
2
1 525 
0
--- 
2017 Q1
4
1 792 
1
1 300 
2016 Q4
5
1 824 
0
--- 
2016 Q3
1
1 304 
0
--- 
2016 Q2
1
323 
0
--- 
2016 Q1
1
1 741 
0
--- 
2015 Q4
4
1 098 
1
1 073 
2015 Q3
2
2 114 
0
--- 
2015 Q2
2
1 478 
0
--- 
2015 Q1
2
1 750 
0
--- 
2014 Q4
3
667 
0
--- 
2014 Q3
2
1 598 
0
--- 
2014 Q1
1
1 481 
0
--- 

Overview of the latest real estate transactions

The following list is an anonymized overview of the latest transactions. For more details and to find all transactions, please use the map to view transactions by plot or the transaction search page for a search by criteria.

2025-04-24
69 679 
Sale
Land
15558 m2
-Terres
Land
14711 m2
-Terres
Land
58845 m2
-Terres
Land
14815 m2
-Prés
Land
317 m2
-Sols
Land
50450 m2
-Terres
Land
25225 m2
-Terres
Land
6182 m2
-Terres
Land
12365 m2
-Terres
Land
44043 m2
-Terres
2025-04-15
205 000 
2 010  /m²(102 m²)
Sale
Houses
House
5 rooms
102 m2
Land
966 m2
-Sols
2025-04-01
300 000 
4 286  /m²(70 m²)
Sale
Houses
House
3 rooms
70 m2
Land
2867 m2
-Sols
Land
1318 m2
-Peupleraies
Land
2512 m2
-Prés
Land
28 m2
-Prés
2025-02-24
333 800 
3 035  /m²(110 m²)
Sale
Houses
House
5 rooms
110 m2
1 outbuilding
Land
990 m2
-Sols
2025-01-29
110 000 
1 250  /m²(88 m²)
Sale
Houses
House
2 rooms
88 m2
Land
3042 m2
-Sols
2025-01-28
1 
Sale
1 outbuilding
2025-01-20
2 823 
Sale
Land
11291 m2
-Terres
2025-01-14
2 893 040 
Sale
Land
500 m2
-Terrains à bâtir
Land
700 m2
-Terrains à bâtir
Land
601 m2
-Terrains à bâtir
Land
607 m2
-Terrains à bâtir
Land
607 m2
-Terrains à bâtir
Land
680 m2
-Terrains à bâtir
Land
581 m2
-Terrains à bâtir
Land
674 m2
-Sols
2024-12-27
6 797 
Sale
Land
10389 m2
-Prés
Land
8108 m2
-Terres
Land
8689 m2
-Prés
2024-11-18
127 260 
2 020  /m²(63 m²)
Sale
Houses
House
3 rooms
63 m2
1 outbuilding
2024-11-06
146 000 
1 014  /m²(144 m²)
Sale
Houses
House
6 rooms
144 m2
Land
2364 m2
-Sols
2024-10-21
86 801 
Sale
Land
4179 m2
-Terrains à bâtir
2024-09-20
114 884 
1 064  /m²(108 m²)
Sale
Houses
House
5 rooms
108 m2
1 outbuilding
Land
1597 m2
-Sols
Land
2537 m2
-Prés
2024-09-19
193 000 
1 582  /m²(122 m²)
Sale
Apartments
Apartment
3 rooms
122 m2
3 outbuildings
2024-07-31
155 500 
1 873  /m²(83 m²)
Sale
Apartments
Apartment
3 rooms
83 m2
2024-07-30
289 000 
3 074  /m²(94 m²)
Sale
Houses
House
4 rooms
94 m2
1 outbuilding
Land
896 m2
-Sols
Land
1057 m2
-Terrains à bâtir
2024-07-17
408 900 
3 195  /m²(128 m²)
Sale
Houses
House
5 rooms
128 m2
2 outbuildings
Land
2223 m2
-Sols
Land
79 m2
-Terres
Land
2 m2
-Terres
Land
108 m2
-Prés
2024-07-16
16 196 
Sale
Land
54637 m2
-Terres
Land
325 m2
-Sols
Land
2280 m2
-Terres
Land
600 m2
-Prés
2024-07-16
500 
Exchange
Land
79 m2
-Terres
Land
2 m2
-Terres
Land
51 m2
-Sols
Land
142 m2
-Sols
Land
108 m2
-Prés
2024-05-02
220 250 
2 686  /m²(82 m²)
Sale
Commercial property
Land
521 m2
-Sols
Houses
House
3 rooms
82 m2
Land
981 m2
-Sols
Land
3096 m2
-Sols
Land
481 m2
-Sols
Land
1068 m2
-Sols
Land
153 m2
-Sols
Land
104 m2
-Sols
Land
146 m2
-Sols
Land
644 m2
-Sols

Ain (01)

Most expensive cities

City
name
Descending orderHouses
house
Price per m²
5 676 
5 576 
5 534 
5 509 
5 248 
5 159 
5 146 
City
name
Descending orderApartments
apt.
Price per m²
5 372 
5 062 
5 000 
4 942 
4 889 
4 836 
4 787 
4 691 

Least expensive cities

City
name
Ascending orderHouses
house
Price per m²
797 
808 
816 
893 
927 
958 
1 034 
1 046 
City
name
Ascending orderApartments
apt.
Price per m²
157 
174 
185 
217 
336 
349 
380 
421 
444