emooki
HomePrice mapTransactions
🇬🇧 English🇫🇷 Français🇩🇪 Deutsch🇪🇸 Español🇮🇹 Italiano

Real estate price map


Real estate price map in the municipality of Baneins, choose a section to see transactions by parcel.

Ain (01)

Baneins - Real estate price m²

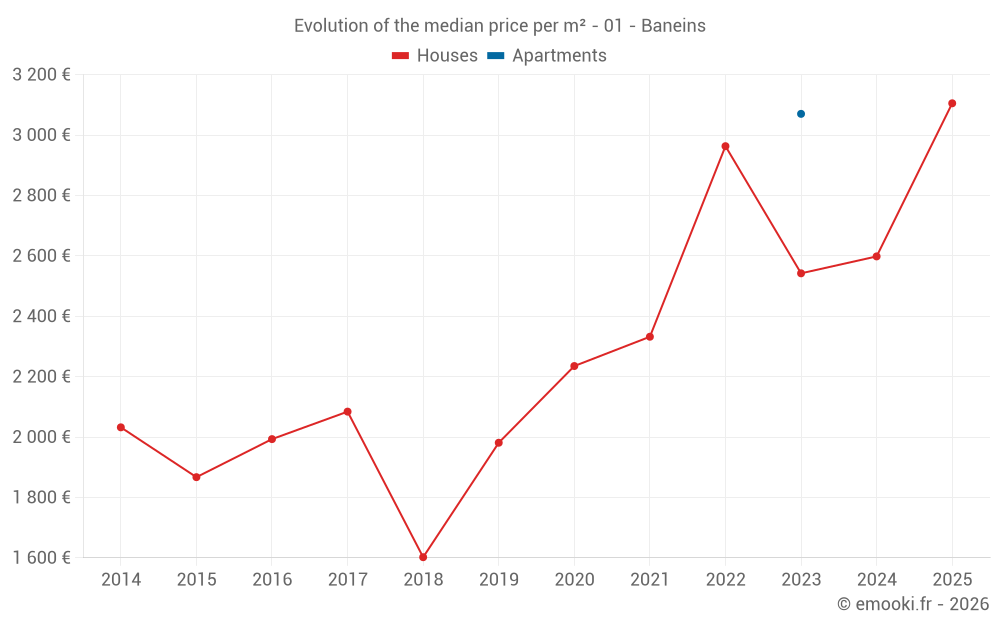
Median price of real estate
in the municipality of Baneins

HousesHouses
2 750  /m²
1-23-45-67-89-10
Reliability 6/10
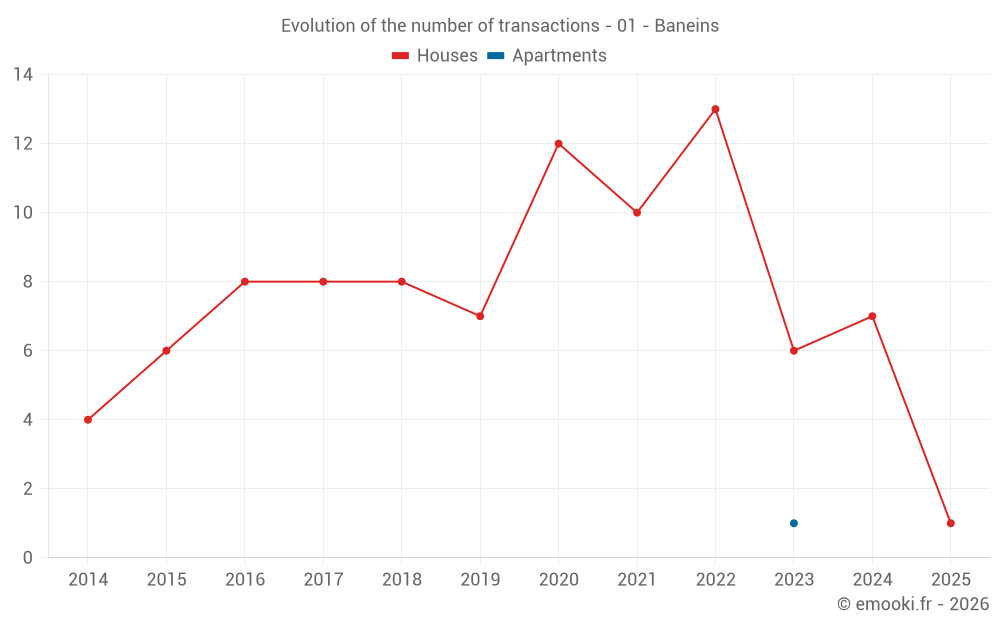
Median price on the 23 transactions of the last 36 months.
from 2 034 to
3 477  /m²
60% of transactions from the 2nd to the 8th deciles.
ApartmentsApartments
3 070  /m²
1-23-45-67-89-10
Reliability 1/10
Price of the unique transaction of the last 120 months.
DwellingsDwellings
2 825  /m²
1-23-45-67-89-10
Reliability 6/10
Median price on the 24 transactions of the last 36 months.
from 2 065 to
3 446  /m²
60% of transactions from the 2nd to the 8th deciles.

Yearly evolution

Evolution of the median price per m²

Evolution of the median price per m² - 01 - Baneins

Evolution of the number of transactions

Warning, last year incomplete. Projections made based on the proportions between semesters of the previous year at the departmental/national level and by type of property.

Evolution of the number of transactions - 01 - Baneins

Yearly data

Descending order
Year
Houses
house
transactions
Houses
house
Price per m²
Apartments
apt.
transactions
Apartments
apt.
Price per m²
2025
1
3 105 
0
--- 
2024
7
2 598 
0
--- 
2023
6
2 542 
1
3 070 
2022
13
2 963 
0
--- 
2021
10
2 332 
0
--- 
2020
12
2 235 
0
--- 
2019
7
1 981 
0
--- 
2018
8
1 602 
0
--- 
2017
8
2 084 
0
--- 
2016
8
1 993 
0
--- 
2015
6
1 867 
0
--- 
2014
4
2 032 
0
--- 

Analysis

Structure of prices per m²

Values of price percentiles per m² over the periods used for the estimated price of each type of property.

Structure of transaction amounts

Values of transaction amounts percentiles over the periods used for the estimated price of each type of property.

Transaction amounts and prices per m² by percentile

Ascending order
Percentile
Houses
house
Price per m²
Houses
house
Transaction amount
Apartments
apt.
Price per m²
Apartments
apt.
Transaction amount
10th percentile
1 489 
175 K
3 070 
175 K
20th percentile
2 034 
211 K
3 070 
175 K
30th percentile
2 251 
229 K
3 070 
175 K
40th percentile
2 574 
248 K
3 070 
175 K
50th percentile
2 750 
273 K
3 070 
175 K
60th percentile
2 991 
296 K
3 070 
175 K
70th percentile
3 366 
308 K
3 070 
175 K
80th percentile
3 477 
355 K
3 070 
175 K
90th percentile
4 237 
383 K
3 070 
175 K

National and departmental comparison

Evolution of the median price per m² of houses

Evolution of the median price per m² of apartments

Quarterly evolution

Evolution of the median price per m²

Evolution of the number of transactions

Quarterly data

Descending order
Quarter
Houses
house
transactions
Houses
house
Price per m²
Apartments
apt.
transactions
Apartments
apt.
Price per m²
2025 Q1
1
3 105 
0
--- 
2024 Q4
2
2 050 
0
--- 
2024 Q3
1
2 625 
0
--- 
2024 Q2
2
2 478 
0
--- 
2024 Q1
2
2 979 
0
--- 
2023 Q4
1
1 401 
1
3 070 
2023 Q3
1
2 333 
0
--- 
2023 Q2
3
2 750 
0
--- 
2023 Q1
1
3 375 
0
--- 
2022 Q4
3
4 523 
0
--- 
2022 Q3
6
2 688 
0
--- 
2022 Q2
3
3 211 
0
--- 
2022 Q1
1
1 140 
0
--- 
2021 Q3
3
3 034 
0
--- 
2021 Q2
5
2 059 
0
--- 
2021 Q1
2
2 036 
0
--- 
2020 Q4
3
1 787 
0
--- 
2020 Q3
3
2 308 
0
--- 
2020 Q2
4
2 316 
0
--- 
2020 Q1
2
1 850 
0
--- 
2019 Q3
1
1 709 
0
--- 
2019 Q2
3
2 056 
0
--- 
2019 Q1
3
1 981 
0
--- 
2018 Q4
4
1 533 
0
--- 
2018 Q3
1
3 182 
0
--- 
2018 Q2
2
1 638 
0
--- 
2018 Q1
1
1 485 
0
--- 
2017 Q4
2
1 806 
0
--- 
2017 Q3
2
2 310 
0
--- 
2017 Q2
2
1 662 
0
--- 
2017 Q1
2
2 160 
0
--- 
2016 Q4
1
2 702 
0
--- 
2016 Q3
4
1 993 
0
--- 
2016 Q2
2
1 139 
0
--- 
2016 Q1
1
2 850 
0
--- 
2015 Q4
3
1 963 
0
--- 
2015 Q2
2
1 580 
0
--- 
2015 Q1
1
1 911 
0
--- 
2014 Q4
1
4 400 
0
--- 
2014 Q3
1
598 
0
--- 
2014 Q2
1
1 889 
0
--- 
2014 Q1
1
2 176 
0
--- 

Overview of the latest real estate transactions

The following list is an anonymized overview of the latest transactions. For more details and to find all transactions, please use the map to view transactions by plot or the transaction search page for a search by criteria.

2025-03-28
1 
Sale
Land
20 m2
-Sols
Land
3810 m2
-Sols
Land
22 m2
-Sols
Land
68 m2
-Sols
Land
66 m2
-Sols
Land
17 m2
-Sols
Land
63 m2
-Sols
2025-03-03
80 000 
Sale
Land
5720 m2
-Prés
2025-01-29
70 000 
Sale
Land
340 m2
-Sols
2025-01-07
295 000 
3 105  /m²(95 m²)
Sale
Houses
House
2 rooms
95 m2
Land
965 m2
-Sols
Land
143 m2
-Terrains d'agrément
Land
197 m2
-Terrains d'agrément
2024-11-22
153 000 
2 125  /m²(72 m²)
Sale
Houses
House
4 rooms
72 m2
Land
81 m2
-Sols
Land
5 m2
-Sols
2024-11-13
300 000 
1 974  /m²(152 m²)
Sale
Houses
House
6 rooms
152 m2
1 outbuilding
Land
878 m2
-Sols
2024-09-23
273 000 
2 625  /m²(104 m²)
Sale
Houses
House
5 rooms
104 m2
1 outbuilding
Land
746 m2
-Sols
2024-06-10
129 000 
1 418  /m²(91 m²)
Sale
Houses
House
4 rooms
91 m2
Land
174 m2
-Sols
Land
9 m2
-Sols
2024-05-30
19 080 
Sale
Land
19080 m2
-Terres
Land
13738 m2
-Terres
Land
30784 m2
-Terres
2024-05-30
15 804 
Sale
Land
26980 m2
-Terres
Land
25700 m2
-Prés
2024-04-22
375 000 
3 538  /m²(106 m²)
Sale
Houses
House
4 rooms
106 m2
4 outbuildings
Land
600 m2
-Sols
Land
1900 m2
-Terrains d'agrément
2024-03-22
420 000 
3 360  /m²(125 m²)
Sale
Houses
House
5 rooms
125 m2
1 outbuilding
Land
1708 m2
-Sols
Land
1860 m2
-Prés
2024-03-21
239 000 
2 598  /m²(92 m²)
Sale
Houses
House
3 rooms
92 m2
Land
525 m2
-Sols
Land
1210 m2
-Prés
2024-02-02
85 000 
Sale
Land
586 m2
-Sols
2023-11-30
197 500 
1 401  /m²(141 m²)
Sale
Houses
House
6 rooms
141 m2
2 outbuildings
Land
614 m2
-Sols
Land
232 m2
-Terrains d'agrément
2023-10-24
175 000 
3 070  /m²(57 m²)
Sale
Apartments
Apartment
3 rooms
57 m2
2023-07-05
5 000 
Sale
Land
14668 m2
-Terres
2023-07-03
210 000 
2 333  /m²(90 m²)
Sale
Houses
House
4 rooms
90 m2
Land
109 m2
-Sols
2023-06-26
248 200 
1 773  /m²(140 m²)
Sale
Houses
House
4 rooms
140 m2
Land
204 m2
-Sols
Land
188 m2
-Sols
Land
13 m2
-Sols
Land
34 m2
-Sols
2023-05-31
320 000 
4 103  /m²(78 m²)
Sale
Houses
House
2 rooms
78 m2
Land
12070 m2
-Terres
Land
24310 m2
-Prés
Land
3100 m2
-Sols
176 transactions listed in the municipality

Ain (01)

Most expensive cities

City
name
Descending orderHouses
house
Price per m²
5 676 
5 576 
5 534 
5 509 
5 248 
5 159 
5 146 
City
name
Descending orderApartments
apt.
Price per m²
5 372 
5 062 
5 000 
4 942 
4 889 
4 836 
4 787 
4 691 

Least expensive cities

City
name
Ascending orderHouses
house
Price per m²
797 
808 
816 
893 
927 
958 
1 034 
1 046 
City
name
Ascending orderApartments
apt.
Price per m²
157 
174 
185 
217 
336 
349 
380 
421 
444