emooki

Real estate price map


Real estate price map in the municipality of Andert-et-Condon, choose a section to see transactions by parcel.

Ain (01)

Price per m² in Andert-et-Condon

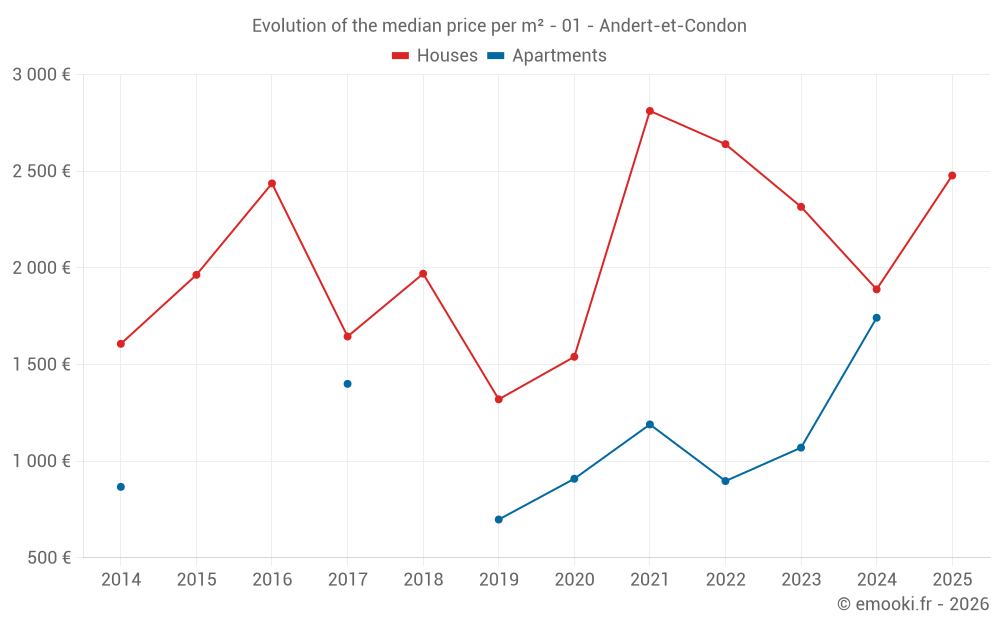
Median price of real estate
in the municipality of Andert-et-Condon

HousesHouses
2 013  /m²
1-23-45-67-89-10
Reliability 6/10
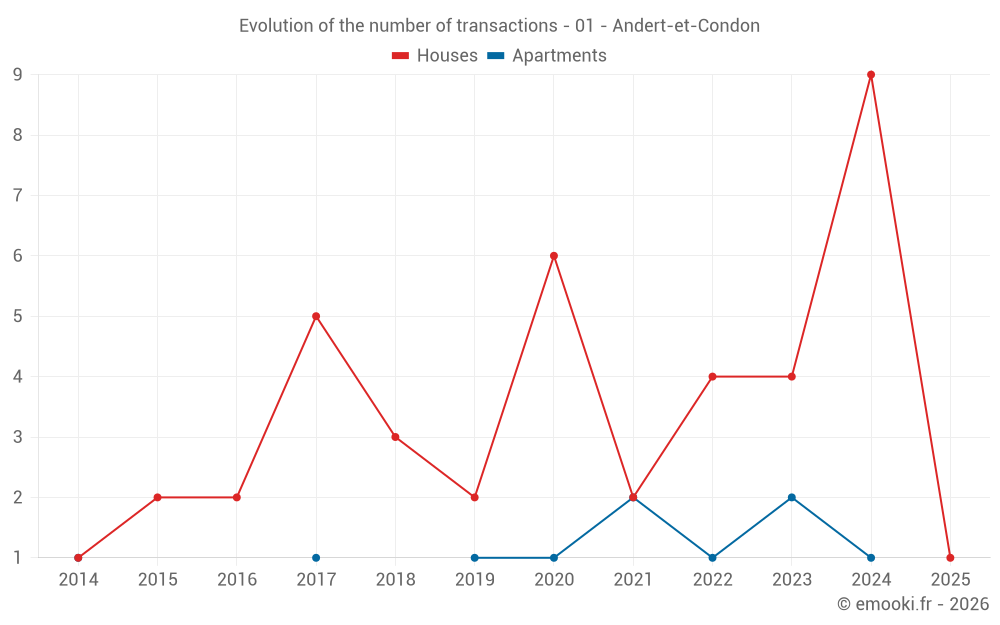
Median price on the 15 transactions of the last 36 months.
from 1 436 to
2 432  /m²
60% of transactions from the 2nd to the 8th deciles.
ApartmentsApartments
1 065  /m²
1-23-45-67-89-10
Reliability 3/10
Median price on the 7 transactions of the last 72 months.
DwellingsDwellings
1 816  /m²
1-23-45-67-89-10
Reliability 6/10
Median price on the 18 transactions of the last 36 months.
from 1 373 to
2 418  /m²
60% of transactions from the 2nd to the 8th deciles.

143 transactions listed in the municipality

Yearly data

Yearly evolution of the median price per m²

Yearly evolution of the median price per m² - 01 - Andert-et-Condon

Yearly evolution of the number of transactions

Yearly evolution of the number of transactions - 01 - Andert-et-Condon

Yearly table

Descending order
Year
Houses
house
transactions
Houses
house
Price per m²
Apartments
apt.
transactions
Apartments
apt.
Price per m²
2025
2
1 908 
0
--- 
2024
9
1 889 
1
1 742 
2023
4
2 316 
2
1 070 
2022
4
2 640 
1
897 
2021
2
2 812 
2
1 190 
2020
6
1 540 
1
909 
2019
2
1 320 
1
698 
2018
3
1 970 
0
--- 
2017
5
1 645 
1
1 400 
2016
2
2 437 
0
--- 
2015
2
1 964 
0
--- 
2014
1
1 607 
1
867 

Analysis

Structure of prices per m²

Values of price percentiles per m² over the periods used for the estimated price of each type of property.

Structure of transaction amounts

Values of transaction amounts percentiles over the periods used for the estimated price of each type of property.

Transaction amounts and prices per m² by percentile

Ascending order
Percentile
Houses
house
Price per m²
Houses
house
Transaction amount
Apartments
apt.
Price per m²
Apartments
apt.
Transaction amount
10th percentile
1 373 
129 K
904 
73 200 
20th percentile
1 436 
165 K
923 
84 600 
30th percentile
1 592 
220 K
966 
92 400 
40th percentile
1 790 
223 K
1 014 
95 800 
50th percentile
2 013 
238 K
1 065 
97 000 
60th percentile
2 264 
257 K
1 121 
108 K
70th percentile
2 398 
284 K
1 190 
117 K
80th percentile
2 432 
301 K
1 285 
123 K
90th percentile
2 687 
373 K
1 486 
134 K

National and departmental comparison

Evolution of the median price per m² of houses

Evolution of the median price per m² of apartments

Quarterly data

Quarterly evolution of the median price per m²

Quarterly evolution of the number of transactions

Quarterly table

Descending order
Quarter
Houses
house
transactions
Houses
house
Price per m²
Apartments
apt.
transactions
Apartments
apt.
Price per m²
2025 Q4
1
1 337 
0
--- 
2025 Q1
1
2 478 
0
--- 
2024 Q4
1
2 420 
0
--- 
2024 Q3
5
1 642 
0
--- 
2024 Q2
2
3 038 
0
--- 
2024 Q1
1
2 013 
1
1 742 
2023 Q4
1
2 218 
0
--- 
2023 Q3
1
2 826 
1
1 159 
2023 Q2
0
--- 
1
980 
2023 Q1
2
1 996 
0
--- 
2022 Q4
1
2 935 
0
--- 
2022 Q2
2
2 640 
0
--- 
2022 Q1
1
2 177 
1
897 
2021 Q4
0
--- 
1
1 065 
2021 Q2
1
3 957 
1
1 316 
2021 Q1
1
1 667 
0
--- 
2020 Q4
1
2 500 
0
--- 
2020 Q3
3
1 200 
1
909 
2020 Q2
1
1 880 
0
--- 
2020 Q1
1
471 
0
--- 
2019 Q4
1
1 406 
0
--- 
2019 Q2
0
--- 
1
698 
2019 Q1
1
1 234 
0
--- 
2018 Q4
1
1 413 
0
--- 
2018 Q2
1
1 970 
0
--- 
2018 Q1
1
3 320 
0
--- 
2017 Q4
1
953 
1
1 400 
2017 Q2
2
2 082 
0
--- 
2017 Q1
2
1 506 
0
--- 
2016 Q4
2
2 437 
0
--- 
2015 Q3
2
1 964 
0
--- 
2014 Q4
1
1 607 
0
--- 
2014 Q2
0
--- 
1
867 

Compare with neighboring municipalities

City
name
Descending orderHouses
house
Price per m²
Apartments
apt.
Price per m²
2 434 
1 415 
2 198 
899 
2 193 
2 017 
2 048 
1 609 
2 013 
1 065 
1 818 
1 479 
1 670 
1 754 
1 667 
1 589 
1 590 
--- 
1 580 
958 

City information

Zip code

  • 01300 ANDERT ET CONDON