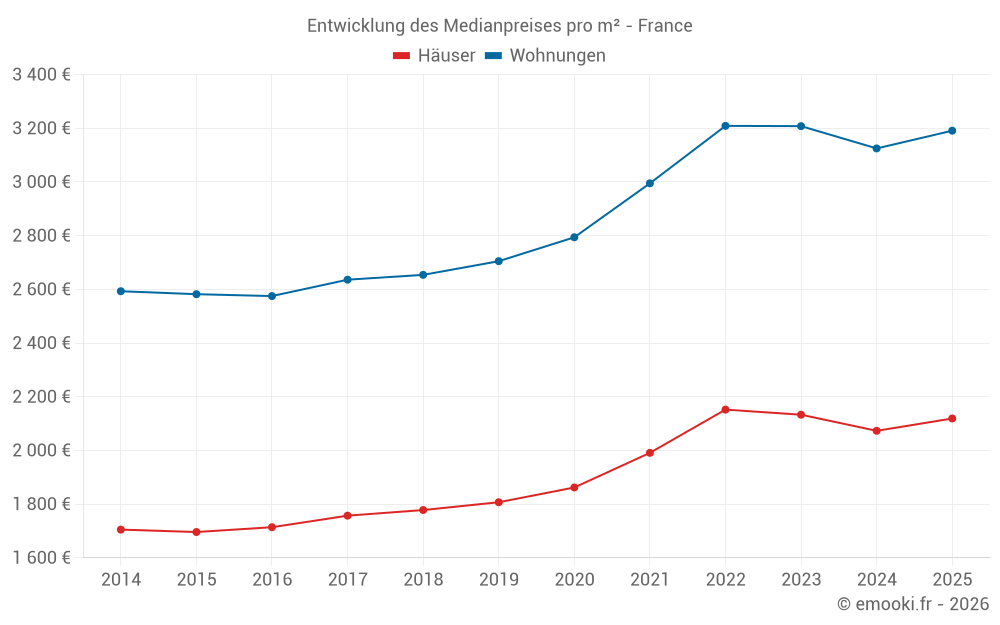
Durchschnittspreis für Immobilien in Frankreich
Häuser
2 143 € /m²
Zuverlässigkeit 10/10
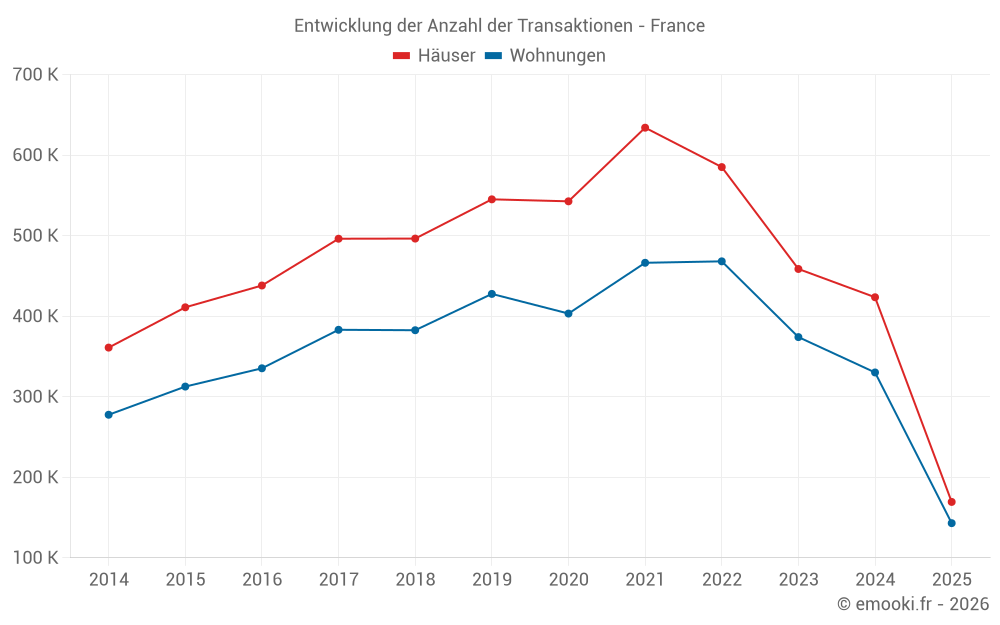
Durchschnittspreis auf den 65262 Transaktionen der letzten 3 Monate.
von 1 197 bis
3 494 € /m²
3 494 € /m²
60% der Transaktionen vom 2. bis zum 8. Dezil.
Wohnungen
3 167 € /m²
Zuverlässigkeit 10/10
Durchschnittspreis auf den 56013 Transaktionen der letzten 3 Monate.
von 1 794 bis
5 240 € /m²
5 240 € /m²
60% der Transaktionen vom 2. bis zum 8. Dezil.
Wohnungen
2 540 € /m²
Zuverlässigkeit 10/10
Durchschnittspreis auf den 121275 Transaktionen der letzten 3 Monate.
von 1 413 bis
4 333 € /m²
4 333 € /m²
60% der Transaktionen vom 2. bis zum 8. Dezil.