emooki
HomePrice mapTransactions
🇬🇧 English🇫🇷 Français🇩🇪 Deutsch🇪🇸 Español🇮🇹 Italiano

Real estate price map


Real estate price map in the municipality of Montreux-Château.

Territoire de Belfort (90)
Montreux-Château

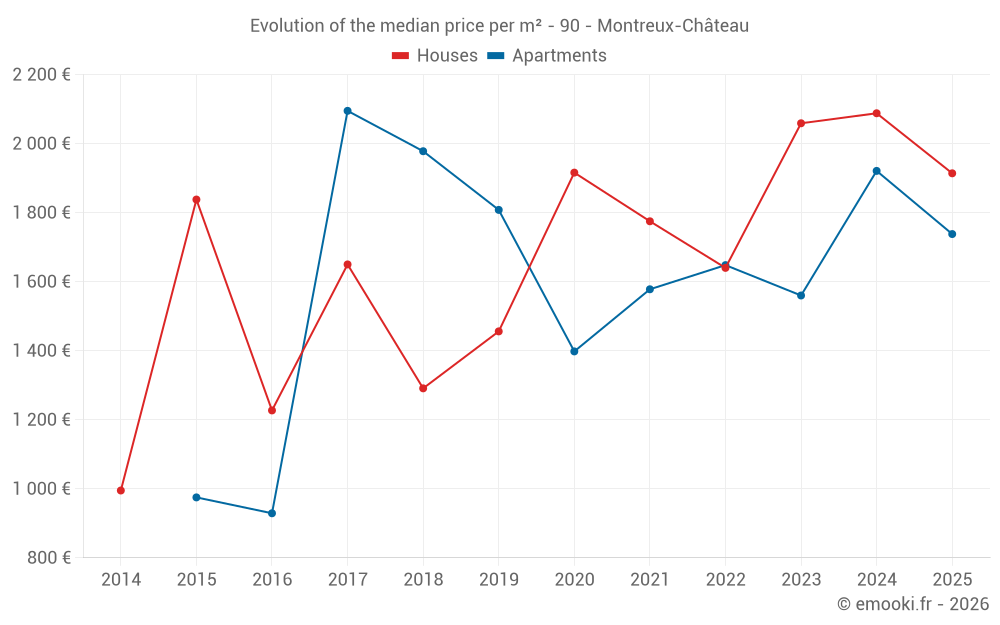
Median price of real estate
in the municipality of Montreux-Château

HousesHouses
1 818  /m²
1-23-45-67-89-10
Reliability 6/10
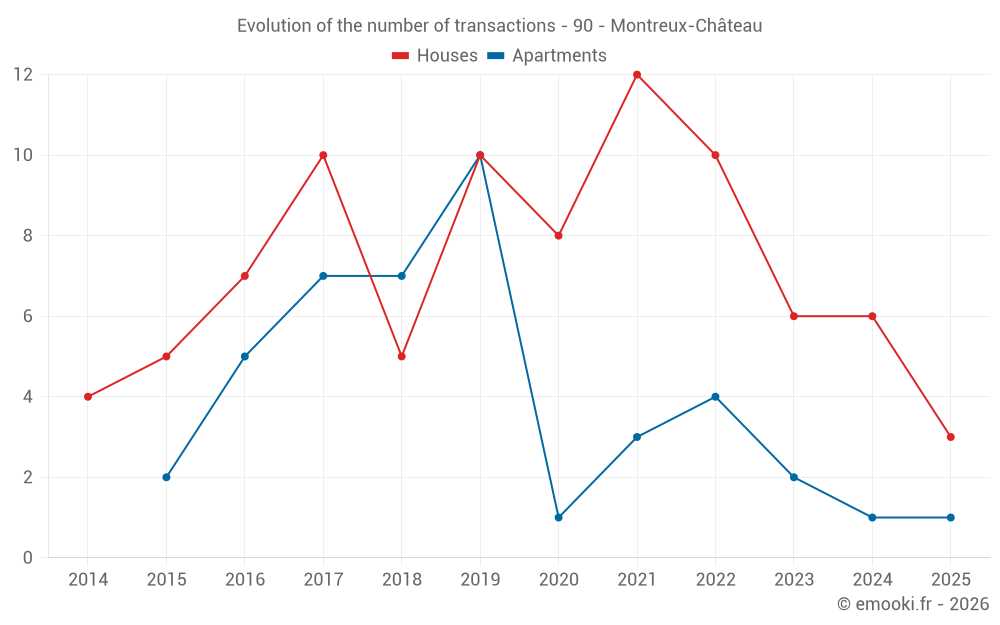
Median price on the 22 transactions of the last 36 months.
from 1 408 to
2 207  /m²
60% of transactions from the 2nd to the 8th deciles.
ApartmentsApartments
1 691  /m²
1-23-45-67-89-10
Reliability 5/10
Median price on the 10 transactions of the last 48 months.
DwellingsDwellings
1 934  /m²
1-23-45-67-89-10
Reliability 7/10
Median price on the 16 transactions of the last 24 months.
from 1 400 to
2 172  /m²
60% of transactions from the 2nd to the 8th deciles.
HousesEvolution of the price per m² of houses since...
1 year
--
2 years
--
3 years
--
4 years
--
5 years
--
6 years
--
7 years
--
8 years
--
9 years
--
10 years
--
11 years
--
ApartmentsEvolution of the price per m² of apartments since...
1 year
--
2 years
--
3 years
--
4 years
--
5 years
--
6 years
--
7 years
--
8 years
--
9 years
--
10 years
--
11 years
--

Yearly evolution

Evolution of the median price per m²

Evolution of the number of transactions

Warning, last year incomplete. Projections made based on the proportions between semesters of the previous year at the departmental/national level and by type of property.

Yearly data

Descending order
Year
Houses
house
transactions
Houses
house
Price per m²
Apartments
apt.
transactions
Apartments
apt.
Price per m²
2025
3
1 914 
1
1 738 
2024
6
2 088 
1
1 921 
2023
6
2 059 
2
1 560 
2022
10
1 640 
4
1 648 
2021
12
1 775 
3
1 578 
2020
8
1 916 
1
1 398 
2019
10
1 456 
10
1 808 
2018
5
1 291 
7
1 978 
2017
10
1 650 
7
2 095 
2016
7
1 227 
5
929 
2015
5
1 838 
2
975 
2014
4
995 
0
--- 

Analysis

Structure of prices per m²

Values of price percentiles per m² over the periods used for the estimated price of each type of property.

Structure of transaction amounts

Values of transaction amounts percentiles over the periods used for the estimated price of each type of property.

Transaction amounts and prices per m² by percentile

Ascending order
Percentile
Houses
house
Price per m²
Houses
house
Transaction amount
Apartments
apt.
Price per m²
Apartments
apt.
Transaction amount
10th percentile
1 042 
131 K
957 
94 850 
20th percentile
1 408 
155 K
1 313 
105 K
30th percentile
1 468 
158 K
1 523 
111 K
40th percentile
1 667 
168 K
1 618 
117 K
50th percentile
1 818 
209 K
1 691 
127 K
60th percentile
1 947 
219 K
1 803 
134 K
70th percentile
2 121 
245 K
1 906 
136 K
80th percentile
2 207 
265 K
1 964 
142 K
90th percentile
2 611 
291 K
2 141 
157 K

National and departmental comparison

Evolution of the median price per m² of houses

Evolution of the median price per m² of apartments

Quarterly evolution

Evolution of the median price per m²

Evolution of the number of transactions

Quarterly data

Descending order
Quarter
Houses
house
transactions
Houses
house
Price per m²
Apartments
apt.
transactions
Apartments
apt.
Price per m²
2025 Q1
3
1 914 
1
1 738 
2024 Q4
2
1 122 
1
1 921 
2024 Q3
2
2 551 
0
--- 
2024 Q1
2
2 395 
0
--- 
2023 Q4
1
2 172 
2
1 560 
2023 Q3
2
1 456 
0
--- 
2023 Q2
1
2 216 
0
--- 
2023 Q1
2
1 988 
0
--- 
2022 Q4
2
1 480 
2
2 041 
2022 Q3
5
1 481 
1
1 395 
2022 Q2
3
2 308 
0
--- 
2022 Q1
0
--- 
1
705 
2021 Q4
4
1 770 
0
--- 
2021 Q3
4
1 866 
2
1 611 
2021 Q2
3
1 750 
0
--- 
2021 Q1
1
2 554 
1
1 414 
2020 Q4
1
2 625 
0
--- 
2020 Q3
3
1 891 
0
--- 
2020 Q2
2
2 521 
0
--- 
2020 Q1
2
1 851 
1
1 398 
2019 Q4
3
1 607 
3
1 886 
2019 Q3
2
1 216 
3
1 790 
2019 Q2
3
1 481 
0
--- 
2019 Q1
2
741 
4
1 262 
2018 Q4
1
969 
1
831 
2018 Q3
1
1 640 
1
2 032 
2018 Q2
2
1 754 
3
1 978 
2018 Q1
1
1 291 
2
1 850 
2017 Q4
5
1 573 
3
2 085 
2017 Q3
0
--- 
3
2 168 
2017 Q2
2
1 688 
1
870 
2017 Q1
3
1 750 
0
--- 
2016 Q4
3
1 345 
2
1 094 
2016 Q3
1
659 
0
--- 
2016 Q2
2
982 
3
846 
2016 Q1
1
1 752 
0
--- 
2015 Q4
1
2 458 
0
--- 
2015 Q3
1
1 544 
2
975 
2015 Q2
1
2 157 
0
--- 
2015 Q1
2
1 568 
0
--- 
2014 Q4
1
1 038 
0
--- 
2014 Q1
3
952 
0
--- 

Territoire de Belfort (90)

Most expensive cities

City
name
Descending orderHouses
house
Price per m²
2 530 
2 480 
2 195 
2 181 
2 176 
2 169 
2 156 
2 138 
2 113 
City
name
Descending orderApartments
apt.
Price per m²
2 400 
1 942 
1 929 
1 908 
1 860 
1 860 
1 772 
1 740 
1 660 

Least expensive cities

City
name
Ascending orderHouses
house
Price per m²
1 148 
1 215 
1 220 
1 264 
1 286 
1 358 
1 390 
1 430 
1 484 
City
name
Ascending orderApartments
apt.
Price per m²
421 
540 
542 
564 
606 
739