Real estate price map
Real estate price map in the municipality of Civray, choose a section to see transactions by parcel.
Vienne (86)
Price per m² in Civray
Median price of real estate
in the municipality of Civray
Houses
1 034 € /m²
Reliability 9/10
Median price on the 24 transactions of the last 6 months.
from 877 to
1 370 € /m²
1 370 € /m²
60% of transactions from the 2nd to the 8th deciles.
Apartments
663 € /m²
Reliability 5/10
Median price on the 13 transactions of the last 48 months.
from 348 to
854 € /m²
854 € /m²
60% of transactions from the 2nd to the 8th deciles.
Dwellings
1 000 € /m²
Reliability 9/10
Median price on the 25 transactions of the last 6 months.
from 849 to
1 369 € /m²
1 369 € /m²
60% of transactions from the 2nd to the 8th deciles.
Evolution of the price per m² of houses since...
1 year
+1.4%
2 years
+0.6%
3 years
+7.8%
4 years
+15%
5 years
+17%
6 years
+29%
7 years
+12%
8 years
+42%
9 years
+28%
10 years
+15%
11 years
+9.3%
791 transactions listed in the municipality
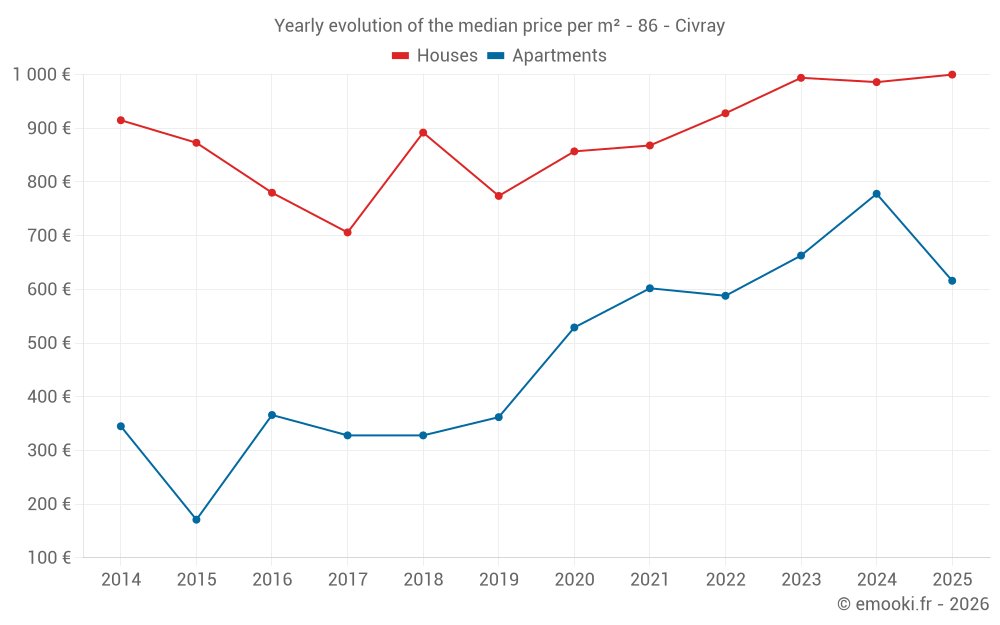
Yearly data
Yearly evolution of the median price per m²
Yearly evolution of the number of transactions

Yearly table
Year
house
transactions
transactions
house
Price per m²
Price per m²
apt.
transactions
transactions
apt.
Price per m²
Price per m²
2025
53
1 000 €
2
616 €
2024
47
986 €
3
778 €
2023
41
994 €
3
663 €
2022
63
928 €
5
588 €
2021
55
868 €
6
602 €
2020
49
857 €
3
529 €
2019
47
774 €
2
362 €
2018
36
892 €
6
328 €
2017
41
706 €
1
328 €
2016
40
780 €
3
366 €
2015
29
873 €
3
171 €
2014
33
915 €
1
345 €
Analysis
Structure of prices per m²
Values of price percentiles per m² over the periods used for the estimated price of each type of property.
Structure of transaction amounts
Values of transaction amounts percentiles over the periods used for the estimated price of each type of property.
Transaction amounts and prices per m² by percentile
Percentile
house
Price per m²
Price per m²
house
Transaction amount
Transaction amount
apt.
Price per m²
Price per m²
apt.
Transaction amount
Transaction amount
10th percentile
727 €
36 500 €
283 €
27 400 €
20th percentile
877 €
70 100 €
348 €
37 400 €
30th percentile
920 €
77 800 €
471 €
50 000 €
40th percentile
985 €
83 028 €
579 €
65 200 €
50th percentile
1 034 €
92 000 €
663 €
100 K€
60th percentile
1 118 €
99 600 €
778 €
108 K€
70th percentile
1 267 €
113 K€
803 €
120 K€
80th percentile
1 370 €
164 K€
854 €
122 K€
90th percentile
1 443 €
183 K€
886 €
144 K€
National and departmental comparison
Evolution of the median price per m² of houses
Evolution of the median price per m² of apartments
Quarterly data
Quarterly evolution of the median price per m²
Quarterly evolution of the number of transactions
Quarterly table
Quarter
house
transactions
transactions
house
Price per m²
Price per m²
apt.
transactions
transactions
apt.
Price per m²
Price per m²
2025 Q4
11
956 €
1
237 €
2025 Q3
13
1 256 €
0
--- €
2025 Q2
18
790 €
0
--- €
2025 Q1
11
1 056 €
1
995 €
2024 Q4
14
810 €
1
840 €
2024 Q3
14
1 170 €
0
--- €
2024 Q2
13
986 €
1
778 €
2024 Q1
6
1 154 €
1
363 €
2023 Q4
10
920 €
0
--- €
2023 Q3
8
924 €
1
864 €
2023 Q2
16
1 096 €
0
--- €
2023 Q1
7
821 €
2
466 €
2022 Q4
12
622 €
0
--- €
2022 Q3
15
1 047 €
2
718 €
2022 Q2
14
774 €
2
558 €
2022 Q1
22
920 €
1
588 €
2021 Q4
14
670 €
2
886 €
2021 Q3
15
1 167 €
0
--- €
2021 Q2
12
982 €
2
373 €
2021 Q1
14
752 €
2
671 €
2020 Q4
23
857 €
2
412 €
2020 Q3
11
1 050 €
1
979 €
2020 Q2
9
925 €
0
--- €
2020 Q1
6
653 €
0
--- €
2019 Q4
18
650 €
2
362 €
2019 Q3
14
846 €
0
--- €
2019 Q2
6
915 €
0
--- €
2019 Q1
9
687 €
0
--- €
2018 Q4
13
1 000 €
2
544 €
2018 Q3
7
963 €
1
106 €
2018 Q2
7
753 €
2
335 €
2018 Q1
9
675 €
1
347 €
2017 Q4
11
630 €
0
--- €
2017 Q3
14
774 €
0
--- €
2017 Q2
10
603 €
1
328 €
2017 Q1
6
679 €
0
--- €
2016 Q4
9
667 €
0
--- €
2016 Q3
12
852 €
1
374 €
2016 Q2
10
1 134 €
0
--- €
2016 Q1
9
690 €
2
261 €
2015 Q4
12
668 €
1
792 €
2015 Q3
10
1 122 €
1
171 €
2015 Q2
4
1 004 €
0
--- €
2015 Q1
3
625 €
1
99 €
2014 Q4
5
713 €
1
345 €
2014 Q3
7
1 114 €
0
--- €
2014 Q2
12
942 €
0
--- €
2014 Q1
9
614 €
0
--- €
Key takeaways
What is the price per m2 of houses in Civray?
The median price on the 24 house transactions of the last 6 months in the municipality of Civray was 1 034 € per square meter for a median property value of 92 000 €. Over this period, 60% of transactions were between 877 and 1 370 € per square meter (from the 2nd to the 8th deciles).
Compare with neighboring municipalities
City
name
name
house
Price per m²
Price per m²
apt.
Price per m²
Price per m²
City information
Zip code
- 86400 CIVRAY