emooki
HomePrice mapTransactions
🇬🇧 English🇫🇷 Français🇩🇪 Deutsch🇪🇸 Español🇮🇹 Italiano

Real estate price map


Real estate price map in the municipality of Tourville-la-Rivière.

Seine-Maritime (76)
Tourville-la-Rivière

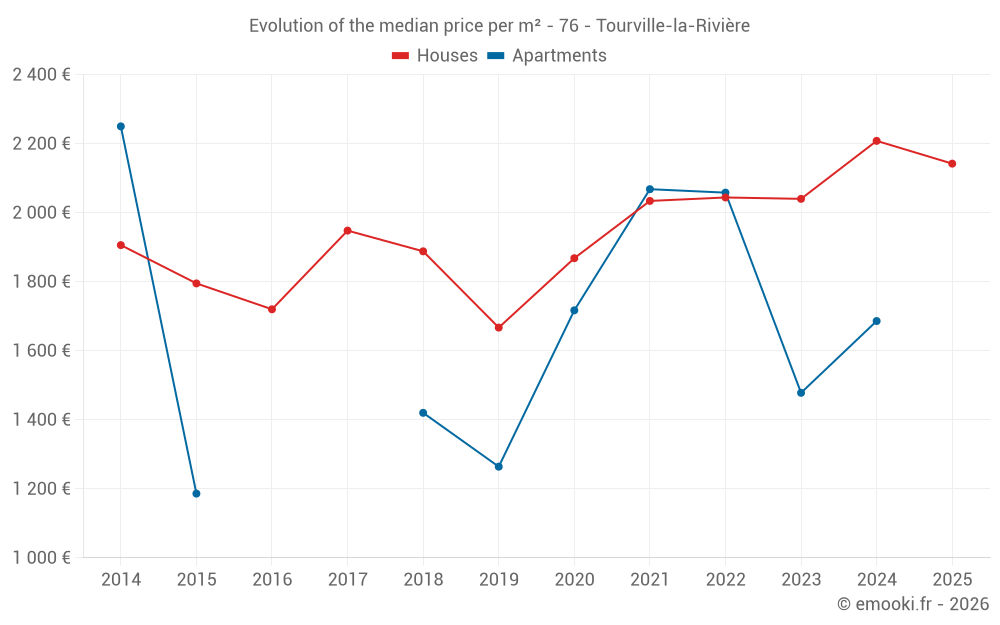
Median price of real estate
in the municipality of Tourville-la-Rivière

HousesHouses
2 164  /m²
1-23-45-67-89-10
Reliability 8/10
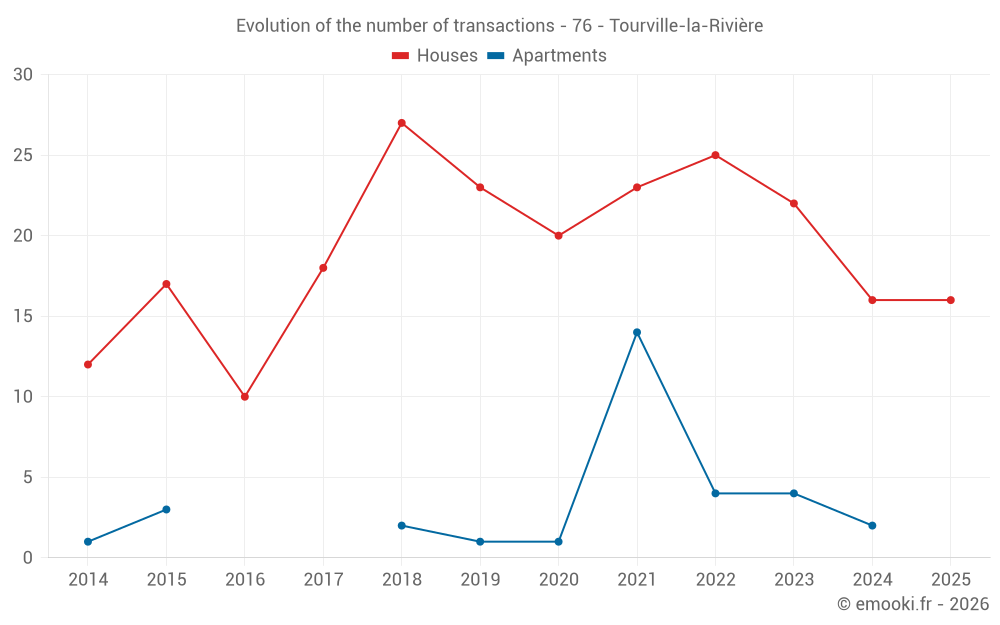
Median price on the 24 transactions of the last 12 months.
from 1 986 to
2 292  /m²
60% of transactions from the 2nd to the 8th deciles.
ApartmentsApartments
2 045  /m²
1-23-45-67-89-10
Reliability 5/10
Median price on the 15 transactions of the last 48 months.
from 1 448 to
2 142  /m²
60% of transactions from the 2nd to the 8th deciles.
DwellingsDwellings
2 142  /m²
1-23-45-67-89-10
Reliability 8/10
Median price on the 26 transactions of the last 12 months.
from 1 915 to
2 276  /m²
60% of transactions from the 2nd to the 8th deciles.
HousesEvolution of the price per m² of houses since...
1 year
-3%
2 years
+5%
3 years
+4.8%
4 years
+5.3%
5 years
+15%
6 years
+28%
7 years
+13%
8 years
+10%
9 years
+25%
10 years
+19%
11 years
+12%
ApartmentsEvolution of the price per m² of apartments since...
1 year
--
2 years
--
3 years
--
4 years
--
5 years
--
6 years
--
7 years
--
8 years
--
9 years
--
10 years
--
11 years
--

Yearly evolution

Evolution of the median price per m²

Evolution of the number of transactions

Warning, last year incomplete. Projections made based on the proportions between semesters of the previous year at the departmental/national level and by type of property.

Yearly data

Descending order
Year
Houses
house
transactions
Houses
house
Price per m²
Apartments
apt.
transactions
Apartments
apt.
Price per m²
2025
16
2 142 
0
--- 
2024
16
2 208 
2
1 686 
2023
22
2 040 
4
1 478 
2022
25
2 044 
4
2 058 
2021
23
2 034 
14
2 068 
2020
20
1 868 
1
1 717 
2019
23
1 667 
1
1 264 
2018
27
1 888 
2
1 420 
2017
18
1 948 
0
--- 
2016
10
1 720 
0
--- 
2015
17
1 795 
3
1 186 
2014
12
1 906 
1
2 250 

Analysis

Structure of prices per m²

Values of price percentiles per m² over the periods used for the estimated price of each type of property.

Structure of transaction amounts

Values of transaction amounts percentiles over the periods used for the estimated price of each type of property.

Transaction amounts and prices per m² by percentile

Ascending order
Percentile
Houses
house
Price per m²
Houses
house
Transaction amount
Apartments
apt.
Price per m²
Apartments
apt.
Transaction amount
10th percentile
1 789 
164 K
1 024 
67 600 
20th percentile
1 986 
188 K
1 448 
78 800 
30th percentile
2 041 
195 K
1 577 
94 543 
40th percentile
2 133 
198 K
1 975 
97 709 
50th percentile
2 164 
198 K
2 045 
117 K
60th percentile
2 236 
210 K
2 093 
133 K
70th percentile
2 276 
215 K
2 119 
156 K
80th percentile
2 292 
234 K
2 142 
163 K
90th percentile
2 457 
284 K
2 171 
192 K

National and departmental comparison

Evolution of the median price per m² of houses

Evolution of the median price per m² of apartments

Quarterly evolution

Evolution of the median price per m²

Evolution of the number of transactions

Quarterly data

Descending order
Quarter
Houses
house
transactions
Houses
house
Price per m²
Apartments
apt.
transactions
Apartments
apt.
Price per m²
2025 Q2
4
2 088 
0
--- 
2025 Q1
12
2 216 
0
--- 
2024 Q4
4
2 779 
1
1 915 
2024 Q3
4
2 081 
1
1 458 
2024 Q2
4
1 824 
0
--- 
2024 Q1
4
2 222 
0
--- 
2023 Q4
4
1 945 
1
2 194 
2023 Q3
6
1 566 
1
2 189 
2023 Q2
7
2 129 
0
--- 
2023 Q1
5
2 344 
2
602 
2022 Q4
7
1 764 
0
--- 
2022 Q3
10
2 022 
2
2 080 
2022 Q2
5
2 413 
1
1 409 
2022 Q1
3
2 000 
1
2 100 
2021 Q4
8
2 068 
2
2 132 
2021 Q3
8
1 812 
3
2 045 
2021 Q2
4
1 926 
5
2 046 
2021 Q1
3
2 173 
4
2 077 
2020 Q4
5
1 748 
0
--- 
2020 Q3
7
1 944 
0
--- 
2020 Q2
3
889 
0
--- 
2020 Q1
5
1 598 
1
1 717 
2019 Q4
7
1 600 
1
1 264 
2019 Q3
8
2 000 
0
--- 
2019 Q2
4
1 502 
0
--- 
2019 Q1
4
1 483 
0
--- 
2018 Q4
6
1 762 
0
--- 
2018 Q3
5
1 906 
2
1 420 
2018 Q2
12
1 998 
0
--- 
2018 Q1
4
1 370 
0
--- 
2017 Q4
2
2 000 
0
--- 
2017 Q3
9
1 948 
0
--- 
2017 Q2
5
2 198 
0
--- 
2017 Q1
2
1 729 
0
--- 
2016 Q3
4
1 948 
0
--- 
2016 Q2
1
1 531 
0
--- 
2016 Q1
5
1 738 
0
--- 
2015 Q4
4
1 686 
0
--- 
2015 Q3
9
1 962 
0
--- 
2015 Q2
2
1 926 
0
--- 
2015 Q1
2
1 373 
3
1 186 
2014 Q4
2
1 942 
0
--- 
2014 Q3
2
1 154 
0
--- 
2014 Q2
2
1 258 
0
--- 
2014 Q1
6
1 805 
1
2 250 

Seine-Maritime (76)

Most expensive cities

City
name
Descending orderHouses
house
Price per m²
4 144 
3 774 
3 243 
3 190 
3 077 
3 032 
2 984 
2 940 
City
name
Descending orderApartments
apt.
Price per m²
3 761 
3 293 
3 278 
3 178 
2 959 

Least expensive cities

City
name
Ascending orderHouses
house
Price per m²
588 
686 
722 
819 
888 
938 
1 071 
1 104 
1 111 
City
name
Ascending orderApartments
apt.
Price per m²
413 
475 
489 
542 
587