emooki
HomePrice mapTransactions
🇬🇧 English🇫🇷 Français🇩🇪 Deutsch🇪🇸 Español🇮🇹 Italiano

Real estate price map


Real estate price map in the municipality of Pissy-Pôville, choose a section to see transactions by parcel.

Seine-Maritime (76)
Pissy-Pôville

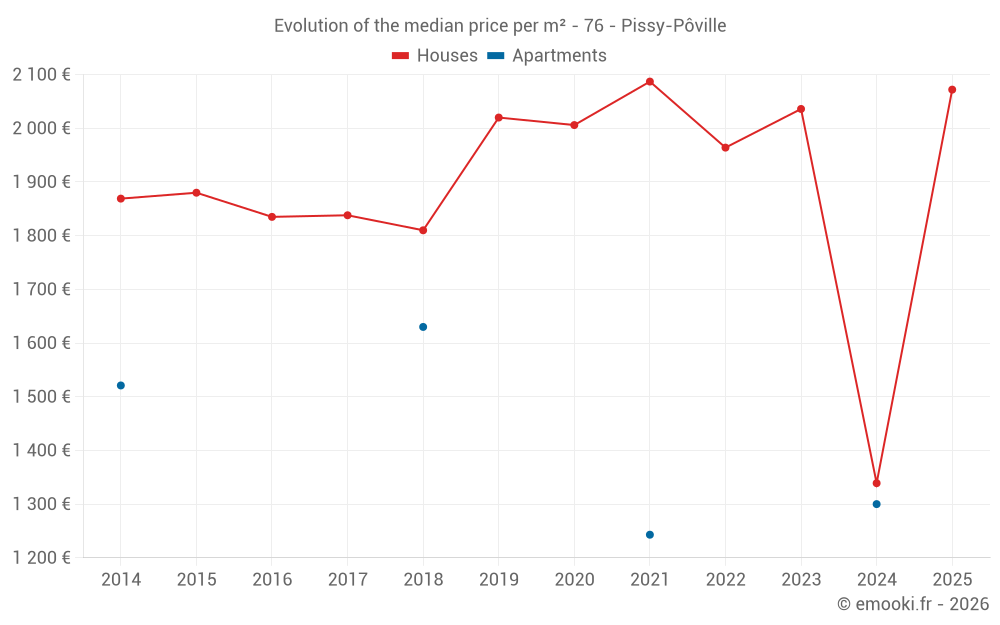
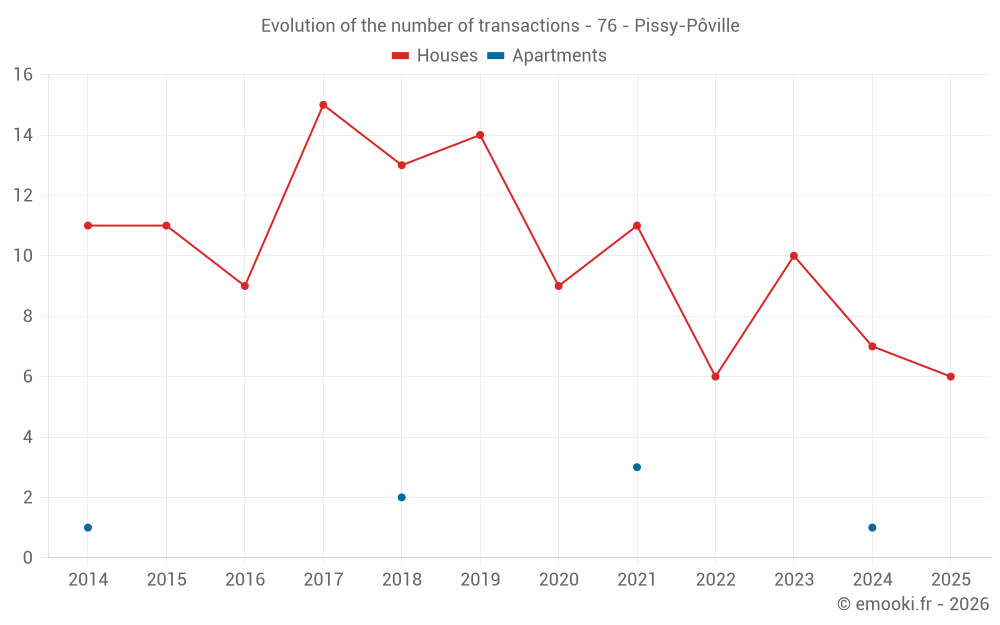
Median price of real estate
in the municipality of Pissy-Pôville

HousesHouses
1 927  /m²
1-23-45-67-89-10
Reliability 7/10
Median price on the 19 transactions of the last 24 months.
from 1 327 to
2 325  /m²
60% of transactions from the 2nd to the 8th deciles.
ApartmentsApartments
1 400  /m²
1-23-45-67-89-10
Reliability 2/10
Median price on the 6 transactions of the last 96 months.
DwellingsDwellings
1 919  /m²
1-23-45-67-89-10
Reliability 7/10
Median price on the 20 transactions of the last 24 months.
from 1 308 to
2 318  /m²
60% of transactions from the 2nd to the 8th deciles.
HousesEvolution of the price per m² of houses since...
1 year
+55%
2 years
+1.8%
3 years
+5.5%
4 years
-0.7%
5 years
+3.3%
6 years
+2.6%
7 years
+14%
8 years
+13%
9 years
+13%
10 years
+10%
11 years
+11%
The price per m² of houses has increased by 55% since 1 year, but it has decreased by 0.7% in 4 years.

Yearly evolution

Evolution of the median price per m²

Evolution of the number of transactions

Warning, last year incomplete. Projections made based on the proportions between semesters of the previous year at the departmental/national level and by type of property.

Yearly data

Descending order
Year
Houses
house
transactions
Houses
house
Price per m²
Apartments
apt.
transactions
Apartments
apt.
Price per m²
2025
6
2 072 
0
--- 
2024
7
1 339 
1
1 300 
2023
10
2 036 
0
--- 
2022
6
1 964 
0
--- 
2021
11
2 087 
3
1 243 
2020
9
2 006 
0
--- 
2019
14
2 020 
0
--- 
2018
13
1 810 
2
1 630 
2017
15
1 838 
0
--- 
2016
9
1 835 
0
--- 
2015
11
1 880 
0
--- 
2014
11
1 869 
1
1 521 

Analysis

Structure of prices per m²

Values of price percentiles per m² over the periods used for the estimated price of each type of property.

Structure of transaction amounts

Values of transaction amounts percentiles over the periods used for the estimated price of each type of property.

Transaction amounts and prices per m² by percentile

Ascending order
Percentile
Houses
house
Price per m²
Houses
house
Transaction amount
Apartments
apt.
Price per m²
Apartments
apt.
Transaction amount
10th percentile
1 147 
188 K
1 193 
83 500 
20th percentile
1 327 
210 K
1 243 
87 000 
30th percentile
1 827 
229 K
1 272 
89 000 
40th percentile
1 880 
246 K
1 300 
91 000 
50th percentile
1 927 
265 K
1 400 
98 000 
60th percentile
2 043 
281 K
1 500 
105 K
70th percentile
2 119 
290 K
1 614 
113 K
80th percentile
2 325 
304 K
1 729 
121 K
90th percentile
2 645 
334 K
1 745 
123 K

National and departmental comparison

Evolution of the median price per m² of houses

Evolution of the median price per m² of apartments

Quarterly evolution

Evolution of the median price per m²

Evolution of the number of transactions

Quarterly data

Descending order
Quarter
Houses
house
transactions
Houses
house
Price per m²
Apartments
apt.
transactions
Apartments
apt.
Price per m²
2025 Q2
4
2 196 
0
--- 
2025 Q1
2
1 900 
0
--- 
2024 Q4
2
802 
0
--- 
2024 Q3
2
1 992 
1
1 300 
2024 Q2
1
1 872 
0
--- 
2024 Q1
2
1 577 
0
--- 
2023 Q4
3
2 146 
0
--- 
2023 Q3
3
1 927 
0
--- 
2023 Q2
4
2 074 
0
--- 
2022 Q3
4
1 984 
0
--- 
2022 Q2
2
1 964 
0
--- 
2021 Q3
3
1 687 
0
--- 
2021 Q2
4
2 350 
0
--- 
2021 Q1
4
2 168 
3
1 243 
2020 Q4
4
2 272 
0
--- 
2020 Q3
3
1 960 
0
--- 
2020 Q2
1
1 056 
0
--- 
2020 Q1
1
2 172 
0
--- 
2019 Q4
1
2 440 
0
--- 
2019 Q3
7
1 967 
0
--- 
2019 Q2
4
1 840 
0
--- 
2019 Q1
2
2 080 
0
--- 
2018 Q4
4
1 391 
0
--- 
2018 Q3
6
1 814 
0
--- 
2018 Q2
2
1 810 
1
1 761 
2018 Q1
1
1 851 
1
1 500 
2017 Q4
2
1 456 
0
--- 
2017 Q3
4
2 120 
0
--- 
2017 Q2
4
1 914 
0
--- 
2017 Q1
5
1 719 
0
--- 
2016 Q4
1
939 
0
--- 
2016 Q3
2
1 748 
0
--- 
2016 Q2
1
1 954 
0
--- 
2016 Q1
5
1 929 
0
--- 
2015 Q4
1
1 995 
0
--- 
2015 Q3
4
1 865 
0
--- 
2015 Q2
3
1 579 
0
--- 
2015 Q1
3
2 088 
0
--- 
2014 Q4
1
2 231 
0
--- 
2014 Q3
5
1 632 
0
--- 
2014 Q2
2
2 056 
0
--- 
2014 Q1
3
1 955 
1
1 521 

Overview of the latest real estate transactions

The following list is an anonymized overview of the latest transactions. For more details and to find all transactions, please use the map to view transactions by plot or the transaction search page for a search by criteria.

2025-06-18
289 100 
2 065  /m²(140 m²)
Sale
Land
85 m2
-Sols
Houses
House
6 rooms
140 m2
Land
648 m2
-Sols
Land
343 m2
-Vergers
2025-04-30
291 100 
2 079  /m²(140 m²)
Sale
Houses
House
4 rooms
140 m2
1 outbuilding
Land
4387 m2
-Vergers
Land
96 m2
-Sols
2025-04-30
328 200 
2 344  /m²(140 m²)
Sale
Houses
House
6 rooms
140 m2
Land
753 m2
-Sols
2025-04-22
263 586 
2 312  /m²(114 m²)
Sale
Houses
House
6 rooms
114 m2
Land
75 m2
-Sols
Land
828 m2
-Jardins
2025-03-31
273 000 
1 845  /m²(148 m²)
Sale
Houses
House
7 rooms
148 m2
Land
812 m2
-Sols
2025-02-20
283 500 
1 955  /m²(145 m²)
Sale
Houses
House
5 rooms
145 m2
1 outbuilding
Land
670 m2
-Sols
2024-12-04
241 000 
1 310  /m²(184 m²)
Sale
Houses
House
6 rooms
184 m2
Land
745 m2
-Sols
Land
128 m2
-Vergers
2024-11-15
25 194 
293  /m²(86 m²)
Sale
Houses
House
3 rooms
86 m2
1 outbuilding
Land
44 m2
-Sols
Land
360 m2
-Sols
Land
926 m2
-Vergers
2024-10-08
215 000 
Sale
Land
262 m2
-Sols
2024-09-30
200 000 
1 220  /m²(164 m²)
Sale
Houses
House
6 rooms
164 m2
1 outbuilding
Land
1245 m2
-Vergers
Land
500 m2
-Sols
2024-09-16
210 000 
2 763  /m²(76 m²)
Sale
Houses
House
4 rooms
76 m2
Land
909 m2
-Vergers
Land
74 m2
-Sols
Land
113 m2
-Vergers
2024-07-05
91 000 
1 300  /m²(70 m²)
Sale
Apartments
Apartment
3 rooms
70 m2
2024-06-20
1 406 731 
698  /m²(2014 m²)
Sale
Commercial property
2014 m2
2024-06-20
3 600 000 
1 787  /m²(2014 m²)
Sale
Commercial property
2014 m2
2024-06-05
18 000 
Sale
Land
188 m2
-Terrains à bâtir
2024-04-29
355 600 
1 872  /m²(190 m²)
Sale
Houses
House
6 rooms
190 m2
1 outbuilding
Land
869 m2
-Terrains d'agrément
Land
500 m2
-Sols
2024-03-29
320 000 
1 339  /m²(239 m²)
Sale
Houses
House
8 rooms
239 m2
Land
197 m2
-Sols
Land
4435 m2
-Vergers
2024-03-11
2 500 
Sale
Land
2324 m2
-Landes
2024-02-07
265 000 
1 815  /m²(146 m²)
Sale
Houses
House
7 rooms
146 m2
Land
1019 m2
-Sols
2023-12-27
140 000 
854  /m²(164 m²)
Sale
Houses
House
6 rooms
164 m2
1 outbuilding
Land
500 m2
-Sols
Land
1245 m2
-Vergers
212 transactions listed in the municipality

Seine-Maritime (76)

Most expensive cities

City
name
Descending orderHouses
house
Price per m²
4 144 
3 774 
3 243 
3 190 
3 077 
3 032 
2 984 
2 940 
City
name
Descending orderApartments
apt.
Price per m²
3 761 
3 293 
3 278 
3 178 
2 959 

Least expensive cities

City
name
Ascending orderHouses
house
Price per m²
588 
686 
722 
819 
888 
938 
1 071 
1 104 
1 111 
City
name
Ascending orderApartments
apt.
Price per m²
413 
475 
489 
542 
587