emooki
HomePrice mapTransactions
🇬🇧 English🇫🇷 Français🇩🇪 Deutsch🇪🇸 Español🇮🇹 Italiano

Real estate price map


Real estate price map in the municipality of Le Perthus, choose a section to see transactions by parcel.

Pyrénées-Orientales (66)

Le Perthus - Real estate price m²

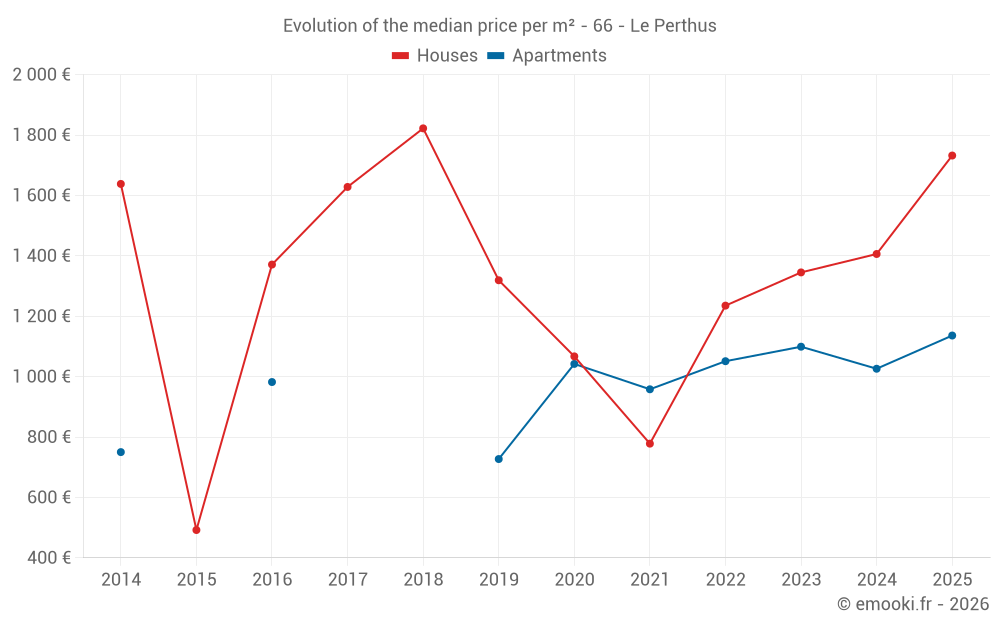
Median price of real estate
in the municipality of Le Perthus

HousesHouses
1 250  /m²
1-23-45-67-89-10
Reliability 6/10
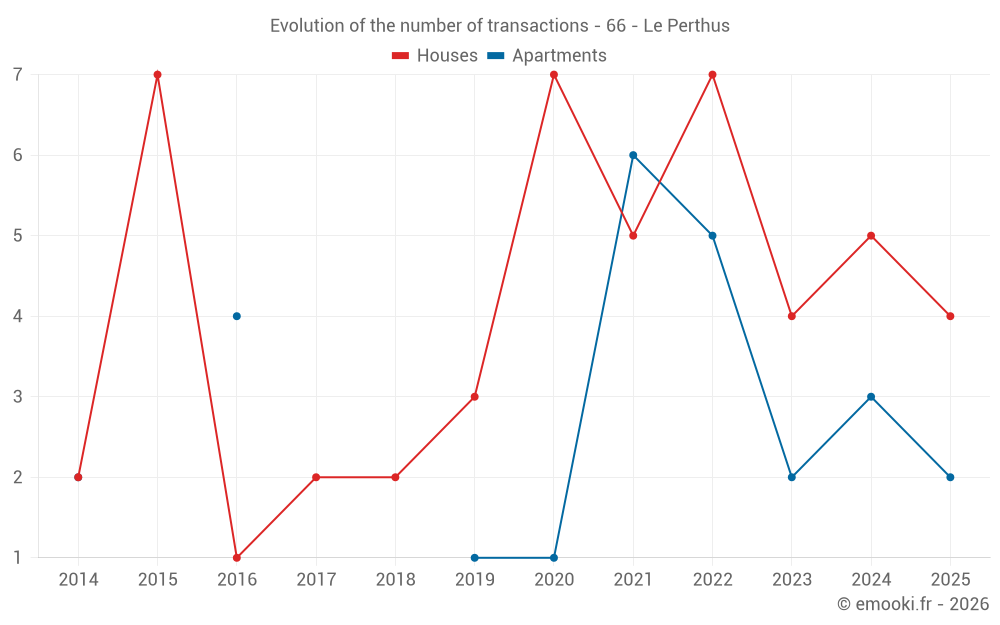
Median price on the 17 transactions of the last 36 months.
from 818 to
1 888  /m²
60% of transactions from the 2nd to the 8th deciles.
ApartmentsApartments
972  /m²
1-23-45-67-89-10
Reliability 5/10
Median price on the 16 transactions of the last 48 months.
from 538 to
1 196  /m²
60% of transactions from the 2nd to the 8th deciles.
DwellingsDwellings
1 196  /m²
1-23-45-67-89-10
Reliability 7/10
Median price on the 19 transactions of the last 24 months.
from 730 to
1 770  /m²
60% of transactions from the 2nd to the 8th deciles.
HousesEvolution of the price per m² of houses since...
1 year
+23%
2 years
+29%
3 years
+40%
4 years
+123%
5 years
+62%
6 years
--
7 years
--
8 years
--
9 years
--
10 years
+252%
11 years
--

Yearly evolution

Evolution of the median price per m²

Evolution of the median price per m² - 66 - Le Perthus

Evolution of the number of transactions

Warning, last year incomplete. Projections made based on the proportions between semesters of the previous year at the departmental/national level and by type of property.

Evolution of the number of transactions - 66 - Le Perthus

Yearly data

Descending order
Year
Houses
house
transactions
Houses
house
Price per m²
Apartments
apt.
transactions
Apartments
apt.
Price per m²
2025
4
1 732 
2
1 136 
2024
5
1 406 
3
1 026 
2023
4
1 345 
2
1 099 
2022
7
1 235 
5
1 051 
2021
5
778 
6
958 
2020
7
1 067 
1
1 042 
2019
3
1 319 
1
727 
2018
2
1 822 
0
--- 
2017
2
1 628 
0
--- 
2016
1
1 371 
4
982 
2015
7
492 
0
--- 
2014
2
1 638 
2
750 

Analysis

Structure of prices per m²

Values of price percentiles per m² over the periods used for the estimated price of each type of property.

Structure of transaction amounts

Values of transaction amounts percentiles over the periods used for the estimated price of each type of property.

Transaction amounts and prices per m² by percentile

Ascending order
Percentile
Houses
house
Price per m²
Houses
house
Transaction amount
Apartments
apt.
Price per m²
Apartments
apt.
Transaction amount
10th percentile
643 
37 600 
507 
31 700 
20th percentile
818 
74 297 
538 
51 250 
30th percentile
938 
79 000 
640 
65 500 
40th percentile
1 167 
84 614 
835 
71 740 
50th percentile
1 250 
130 K
972 
81 500 
60th percentile
1 470 
137 K
1 051 
90 000 
70th percentile
1 733 
165 K
1 094 
98 250 
80th percentile
1 888 
189 K
1 196 
110 K
90th percentile
1 944 
205 K
1 330 
137 K

National and departmental comparison

Evolution of the median price per m² of houses

Evolution of the median price per m² of apartments

Quarterly evolution

Evolution of the median price per m²

Evolution of the number of transactions

Quarterly data

Descending order
Quarter
Houses
house
transactions
Houses
house
Price per m²
Apartments
apt.
transactions
Apartments
apt.
Price per m²
2025 Q2
1
889 
1
625 
2025 Q1
3
1 951 
1
1 646 
2024 Q4
0
--- 
1
1 026 
2024 Q3
1
1 406 
1
1 196 
2024 Q2
2
792 
0
--- 
2024 Q1
2
1 788 
1
538 
2023 Q4
1
1 940 
1
917 
2023 Q3
2
506 
1
1 281 
2023 Q1
1
1 890 
0
--- 
2022 Q4
1
1 235 
1
656 
2022 Q3
3
950 
0
--- 
2022 Q2
1
370 
4
1 080 
2022 Q1
2
2 506 
0
--- 
2021 Q4
1
568 
4
668 
2021 Q3
1
530 
0
--- 
2021 Q2
0
--- 
2
1 439 
2021 Q1
3
1 940 
0
--- 
2020 Q4
3
449 
0
--- 
2020 Q3
2
720 
0
--- 
2020 Q2
1
2 000 
0
--- 
2020 Q1
1
1 067 
1
1 042 
2019 Q4
1
850 
0
--- 
2019 Q3
0
--- 
1
727 
2019 Q2
1
1 319 
0
--- 
2019 Q1
1
1 516 
0
--- 
2018 Q3
1
1 633 
0
--- 
2018 Q2
1
2 011 
0
--- 
2017 Q4
1
1 226 
0
--- 
2017 Q2
1
2 029 
0
--- 
2016 Q4
0
--- 
2
618 
2016 Q3
1
1 371 
0
--- 
2016 Q1
0
--- 
2
1 966 
2015 Q4
1
758 
0
--- 
2015 Q2
2
391 
0
--- 
2015 Q1
4
255 
0
--- 
2014 Q3
2
1 638 
0
--- 
2014 Q2
0
--- 
1
800 
2014 Q1
0
--- 
1
700 

Overview of the latest real estate transactions

The following list is an anonymized overview of the latest transactions. For more details and to find all transactions, please use the map to view transactions by plot or the transaction search page for a search by criteria.

2025-06-12
25 000 
625  /m²(40 m²)
Sale
Apartments
Apartment
3 rooms
40 m2
Land
36 m2
-Sols
Land
72 m2
-Sols
2025-06-03
10 000 
Sale
Land
3100 m2
-Futaies feuillues
/Chênes-lièges
Land
10800 m2
-Taillis simples
2025-04-11
80 000 
889  /m²(90 m²)
Sale
Houses
House
3 rooms
90 m2
Land
103 m2
-Sols
2025-03-26
195 000 
1 512  /m²(129 m²)
Sale
Houses
House
4 rooms
129 m2
Land
95 m2
-Sols
2025-02-28
223 000 
2 372  /m²(94 m²)
Sale
Houses
House
3 rooms
94 m2
Land
384 m2
-Sols
2025-01-21
135 000 
1 646  /m²(82 m²)
Sale
Apartments
Apartment
4 rooms
82 m2
1 outbuilding
2025-01-14
80 000 
1 951  /m²(41 m²)
Sale
Houses
House
2 rooms
41 m2
Land
217 m2
-Sols
2024-11-15
158 000 
1 026  /m²(154 m²)
Sale
Apartments
Apartment
3 rooms
84 m2
Apartments
Apartment
3 rooms
70 m2
2 outbuildings
Land
238 m2
-Sols
2024-11-08
146 000 
293  /m²(498 m²)
438  /m²(333 m²)
Auction
Commercial property
69 m2
Apartments
Apartment
2 rooms
55 m2
Apartments
Apartment
2 rooms
55 m2
Apartments
Apartment
2 rooms
55 m2
Commercial property
59 m2
Land
75 m2
-Sols
Apartments
Apartment
3 rooms
56 m2
Apartments
Apartment
2 rooms
56 m2
Apartments
Apartment
2 rooms
56 m2
Commercial property
37 m2
Land
107 m2
-Sols
2024-09-23
71 740 
1 196  /m²(60 m²)
Sale
Apartments
Apartment
3 rooms
60 m2
2 outbuildings
2024-07-16
135 000 
1 406  /m²(96 m²)
Sale
Houses
House
4 rooms
96 m2
Land
96 m2
-Sols
2024-06-21
175 000 
989  /m²(177 m²)
1 944  /m²(90 m²)
Sale
Houses
House
6 rooms
90 m2
Commercial property
87 m2
Land
347 m2
-Sols
2024-06-10
59 000 
Sale
1 outbuilding
Land
70 m2
-Terres
Land
95 m2
-Sols
Land
31 m2
-Sols
2024-04-23
37 000 
463  /m²(80 m²)
Sale
Houses
House
4 rooms
80 m2
Land
60 m2
-Sols
2024-04-05
185 000 
1 121  /m²(165 m²)
Sale
Houses
House
5 rooms
165 m2
Land
170 m2
-Sols
Land
162 m2
-Sols
2024-02-29
3 300 
Sale
Land
31 m2
-Sols
2024-02-05
70 000 
538  /m²(130 m²)
Sale
Apartments
Apartment
3 rooms
34 m2
Apartments
Apartment
3 rooms
34 m2
Apartments
Apartment
3 rooms
34 m2
Apartments
Apartment
3 rooms
28 m2
2 outbuildings
Land
185 m2
-Sols
2024-01-22
220 000 
1 880  /m²(117 m²)
Sale
Houses
House
4 rooms
117 m2
Land
434 m2
-Sols
Land
53 m2
-Sols
Land
4 m2
-Sols
2024-01-04
190 000 
1 696  /m²(112 m²)
Sale
Houses
House
5 rooms
112 m2
Land
670 m2
-Sols
Land
471 m2
-Sols
2023-12-28
110 000 
917  /m²(120 m²)
Sale
Apartments
Apartment
3 rooms
90 m2
Apartments
Apartment
1 room
30 m2
2 outbuildings
114 transactions listed in the municipality

Pyrénées-Orientales (66)

Most expensive cities

City
name
Descending orderHouses
house
Price per m²
4 917 
4 606 
4 559 
4 360 
4 173 
3 866 
3 782 
City
name
Descending orderApartments
apt.
Price per m²
5 288 
3 778 
3 636 
3 518 
3 476 
3 467 
3 448 
3 438 

Least expensive cities

City
name
Ascending orderHouses
house
Price per m²
566 
570 
574 
615 
643 
732 
818 
822 
City
name
Ascending orderApartments
apt.
Price per m²
196 
231 
330 
355 
375 
403 
421 
465