emooki
HomePrice mapTransactions
🇬🇧 English🇫🇷 Français🇩🇪 Deutsch🇪🇸 Español🇮🇹 Italiano

Real estate price map


Real estate price map in the municipality of Llo, choose a section to see transactions by parcel.

Pyrénées-Orientales (66)

Llo - Real estate price m²

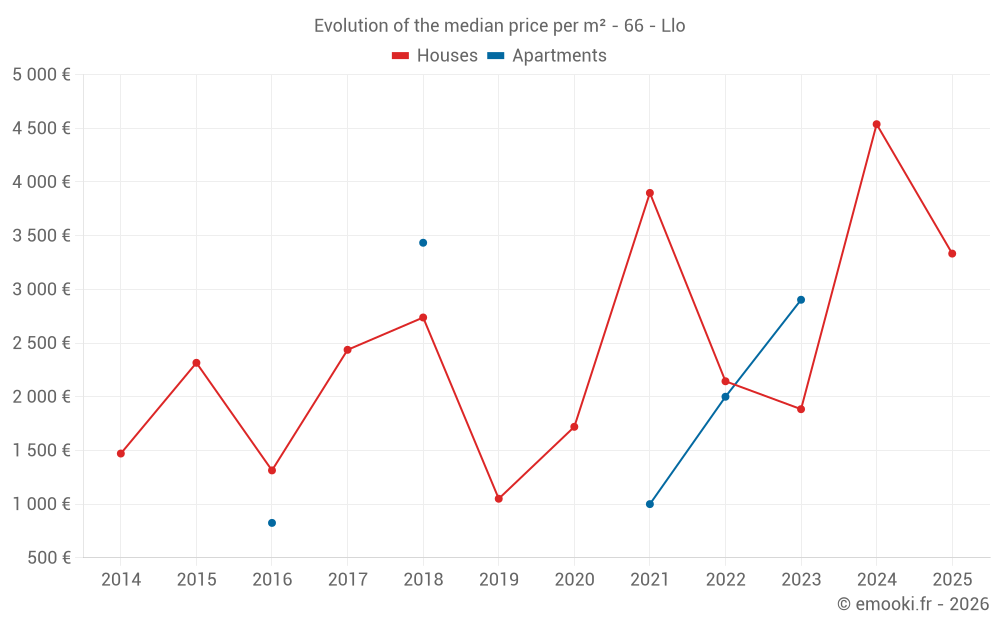
Median price of real estate
in the municipality of Llo

HousesHouses
3 148  /m²
1-23-45-67-89-10
Reliability 5/10
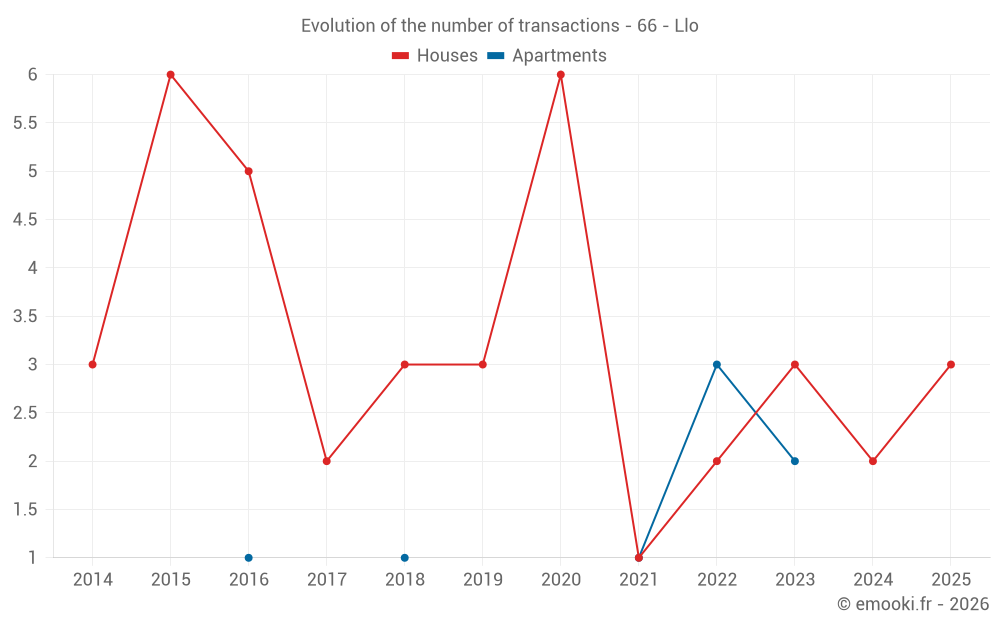
Median price on the 11 transactions of the last 48 months.
from 1 609 to
3 898  /m²
60% of transactions from the 2nd to the 8th deciles.
ApartmentsApartments
1 972  /m²
1-23-45-67-89-10
Reliability 3/10
Median price on the 6 transactions of the last 72 months.
DwellingsDwellings
2 500  /m²
1-23-45-67-89-10
Reliability 6/10
Median price on the 13 transactions of the last 36 months.
from 1 719 to
3 892  /m²
60% of transactions from the 2nd to the 8th deciles.

Yearly evolution

Evolution of the median price per m²

Evolution of the median price per m² - 66 - Llo

Evolution of the number of transactions

Warning, last year incomplete. Projections made based on the proportions between semesters of the previous year at the departmental/national level and by type of property.

Evolution of the number of transactions - 66 - Llo

Yearly data

Descending order
Year
Houses
house
transactions
Houses
house
Price per m²
Apartments
apt.
transactions
Apartments
apt.
Price per m²
2025
3
3 333 
0
--- 
2024
2
4 538 
0
--- 
2023
3
1 884 
2
2 903 
2022
2
2 144 
3
2 000 
2021
1
3 898 
1
1 000 
2020
6
1 720 
0
--- 
2019
3
1 050 
0
--- 
2018
3
2 738 
1
3 434 
2017
2
2 437 
0
--- 
2016
5
1 314 
1
825 
2015
6
2 316 
0
--- 
2014
3
1 471 
0
--- 

Analysis

Structure of prices per m²

Values of price percentiles per m² over the periods used for the estimated price of each type of property.

Structure of transaction amounts

Values of transaction amounts percentiles over the periods used for the estimated price of each type of property.

Transaction amounts and prices per m² by percentile

Ascending order
Percentile
Houses
house
Price per m²
Houses
house
Transaction amount
Apartments
apt.
Price per m²
Apartments
apt.
Transaction amount
10th percentile
1 140 
50 000 
1 275 
52 500 
20th percentile
1 609 
84 800 
1 550 
75 000 
30th percentile
1 884 
130 K
1 746 
132 K
40th percentile
2 826 
130 K
1 943 
189 K
50th percentile
3 148 
170 K
1 972 
192 K
60th percentile
3 333 
180 K
2 000 
195 K
70th percentile
3 475 
230 K
2 250 
203 K
80th percentile
3 898 
254 K
2 500 
210 K
90th percentile
4 170 
370 K
3 378 
241 K

National and departmental comparison

Evolution of the median price per m² of houses

Evolution of the median price per m² of apartments

Quarterly evolution

Evolution of the median price per m²

Evolution of the number of transactions

Quarterly data

Descending order
Quarter
Houses
house
transactions
Houses
house
Price per m²
Apartments
apt.
transactions
Apartments
apt.
Price per m²
2025 Q1
3
3 333 
0
--- 
2024 Q3
2
4 538 
0
--- 
2023 Q3
0
--- 
1
1 550 
2023 Q2
1
556 
1
4 256 
2023 Q1
2
2 680 
0
--- 
2022 Q4
0
--- 
1
1 943 
2022 Q3
0
--- 
2
2 250 
2022 Q2
2
2 144 
0
--- 
2021 Q4
1
3 898 
0
--- 
2021 Q1
0
--- 
1
1 000 
2020 Q4
3
1 641 
0
--- 
2020 Q3
1
1 800 
0
--- 
2020 Q2
1
1 553 
0
--- 
2020 Q1
1
2 309 
0
--- 
2019 Q4
1
1 609 
0
--- 
2019 Q3
1
1 050 
0
--- 
2019 Q1
1
1 000 
0
--- 
2018 Q4
0
--- 
1
3 434 
2018 Q2
2
1 894 
0
--- 
2018 Q1
1
2 738 
0
--- 
2017 Q4
1
3 194 
0
--- 
2017 Q1
1
1 680 
0
--- 
2016 Q4
1
680 
0
--- 
2016 Q3
1
2 014 
0
--- 
2016 Q2
1
1 551 
1
825 
2016 Q1
2
1 275 
0
--- 
2015 Q4
2
3 258 
0
--- 
2015 Q3
1
1 867 
0
--- 
2015 Q2
3
1 500 
0
--- 
2014 Q1
3
1 471 
0
--- 

Overview of the latest real estate transactions

The following list is an anonymized overview of the latest transactions. For more details and to find all transactions, please use the map to view transactions by plot or the transaction search page for a search by criteria.

2025-04-16
3 468 
Sale
Land
1310 m2
-Landes
Land
9840 m2
-Landes
2025-03-28
254 400 
4 170  /m²(61 m²)
Sale
Houses
House
4 rooms
61 m2
1 outbuilding
2025-03-14
370 000 
1 609  /m²(230 m²)
Sale
Houses
House
5 rooms
230 m2
Land
646 m2
-Sols
2025-01-24
180 000 
3 333  /m²(54 m²)
Sale
Houses
House
2 rooms
54 m2
Land
42 m2
-Sols
2025-01-23
12 193 
Sale
Land
1630 m2
-Terres
Land
1940 m2
-Landes
Land
1975 m2
-Landes
Land
1720 m2
-Landes
Land
1830 m2
-Terres
Land
1975 m2
-Landes
Land
1915 m2
-Terres
Land
3971 m2
-Terres
Land
595 m2
-Terres
Land
345 m2
-Terres
Land
9200 m2
-Landes
2024-11-08
2 000 
Sale
Land
1310 m2
-Landes
Land
9840 m2
-Landes
2024-11-08
120 000 
Sale
Land
950 m2
-Terres
2024-07-11
130 000 
2 826  /m²(46 m²)
Sale
Houses
House
3 rooms
46 m2
Land
62 m2
-Sols
Land
137 m2
-Sols
Land
38 m2
-Sols
Land
74 m2
-Sols
2024-07-11
50 000 
6 250  /m²(8 m²)
Sale
Houses
House
1 room
8 m2
Land
13 m2
-Sols
Land
137 m2
-Sols
Land
59 m2
-Sols
2024-03-08
1 000 
Sale
Land
1185 m2
-Terres
Land
6550 m2
-Prés
Land
3245 m2
-Landes
Land
1455 m2
-Prés
2024-03-01
8 000 
Sale
Land
3878 m2
-Terres
2024-02-20
1 039 
Sale
Land
1860 m2
-Landes
Land
3020 m2
-Landes
Land
315 m2
-Landes
2023-10-02
40 000 
Sale
Land
58 m2
-Sols
Land
258 m2
-Landes
Land
350 m2
-Landes
2023-09-22
800 
Sale
Land
380 m2
-Landes
2023-09-22
8 200 
Sale
Land
1780 m2
-Landes
Land
3195 m2
-Prés
Land
5765 m2
-Prés
Land
660 m2
-Prés
Land
2270 m2
-Prés
Land
10 m2
-Sols
Land
5 m2
-Sols
Land
2820 m2
-Prés
2023-09-20
195 283 
1 550  /m²(126 m²)
Sale
Apartments
Apartment
4 rooms
86 m2
Apartments
Apartment
3 rooms
40 m2
1 outbuilding
Land
430 m2
-Sols
2023-06-09
272 360 
4 256  /m²(64 m²)
Sale
Apartments
Apartment
2 rooms
40 m2
Apartments
Apartment
1 room
24 m2
3 outbuildings
Land
631 m2
-Sols
2023-05-12
14 000 
Sale
Land
997 m2
-Landes
2023-04-20
40 000 
556  /m²(72 m²)
Sale
Houses
House
3 rooms
72 m2
Land
49 m2
-Sols
Land
195 m2
-Sols
Land
10 m2
-Sols
2023-03-24
84 800 
1 884  /m²(45 m²)
Sale
Houses
House
3 rooms
45 m2
Land
26 m2
-Sols
95 transactions listed in the municipality

Pyrénées-Orientales (66)

Most expensive cities

City
name
Descending orderHouses
house
Price per m²
4 917 
4 606 
4 559 
4 360 
4 173 
3 866 
3 782 
City
name
Descending orderApartments
apt.
Price per m²
5 288 
3 778 
3 636 
3 518 
3 476 
3 467 
3 448 
3 438 

Least expensive cities

City
name
Ascending orderHouses
house
Price per m²
566 
570 
574 
615 
643 
732 
818 
822 
City
name
Ascending orderApartments
apt.
Price per m²
196 
231 
330 
355 
375 
403 
421 
465